

10 Ways Infographics Strengthen Your Business Plan

Infographics are a powerful communication device. They can simplify complex data, organize critical information, and are more persuasive than text [1]. For these reasons, infographics should not be treated as non-essential accessories to your business plan – they should be an integral part of it.
Infographics are defined as visuals or images (such as charts and diagrams) that are used to represent data or information.
Think about your relationship with infographics: Traffic signs. Web browser icons. Election maps. In the last week, you’ve likely absorbed more information through infographics than you have through text-based material. And because we can process visuals 10 times faster than we blink [2], it’s sometimes lost on us how ubiquitous infographics actually are.
If you’re a founder or business development professional, at some point you will be tasked with producing a business plan and/or pitch deck to raise capital. These documents exist to relay critical information and demonstrate your value.
Strategically-designed infographics can transform your business plan from a generic proposal to a high-impact marketing document. In this article, we break down the 10 different ways you can use infographics to strengthen your business plan.
1. Statistical Infographics
Command Attention with Key Market Statistics
When compiling market research that supports your business plan, you may find key statistics that validate your core argument. This could be financial data reported within your niche sector or the growth rates across different revenue streams. Emphasizing this data with statistical infographics is a strategic move that anchors critical figures in an investor’s mind.
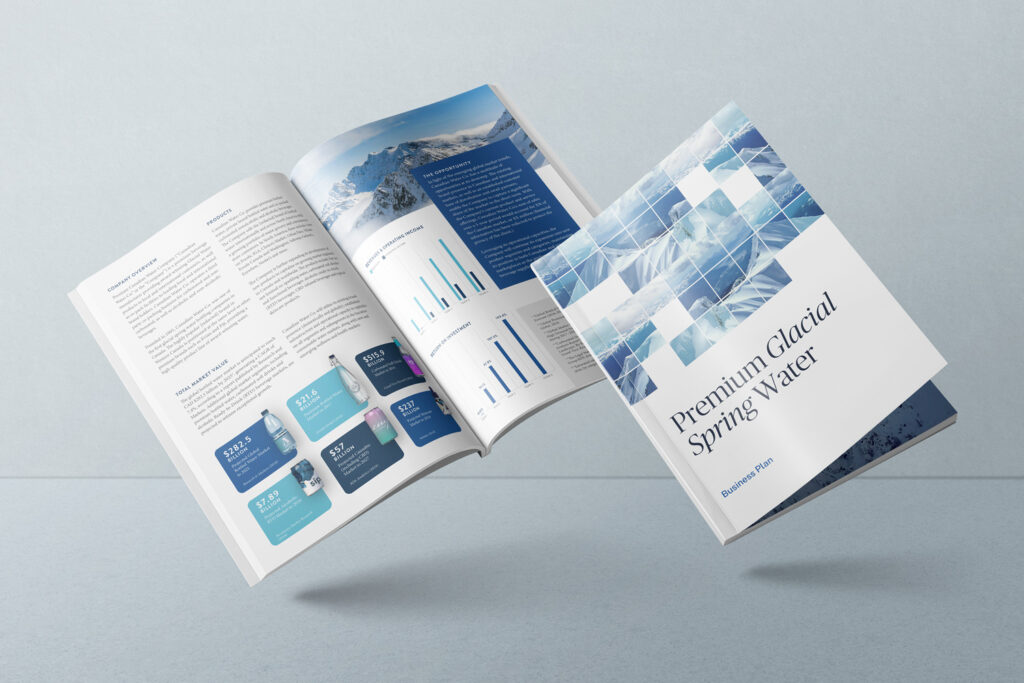
2. Data Visualization
Make Your Data Memorable Through Visualization
For many of us, charts and graphs are a no-brainer when it comes to relaying data in a business plan. Consider sprucing up the standard Microsoft Word graphs by adjusting the colours to match your branding or increasing the text size of values you wish to highlight.
One powerful technique is to use thematic visuals to represent the data. For example, if you want to illustrate the growth of your industry over a 5-year period, consider using a visual element — one relevant to your industry — that grows in size at the same compound annual growth rate (CAGR) as your data. However, a word of caution: prioritize accuracy. An imprecise data visualization undermines your credibility and becomes mere decoration.
3. Business Model Visuals
Clearly Articulate Your Revenue Engine
One of the essential questions your business plan will address is “how are you generating revenue?” or “how will you generate revenue?” You could opt for a simple table or a bullet-point list, but given the foundational importance of this information, transforming your revenue model into a central infographic is a strategic imperative. This helps establish your position early in the document, and it helps your reader better visualize the important elements of your business.

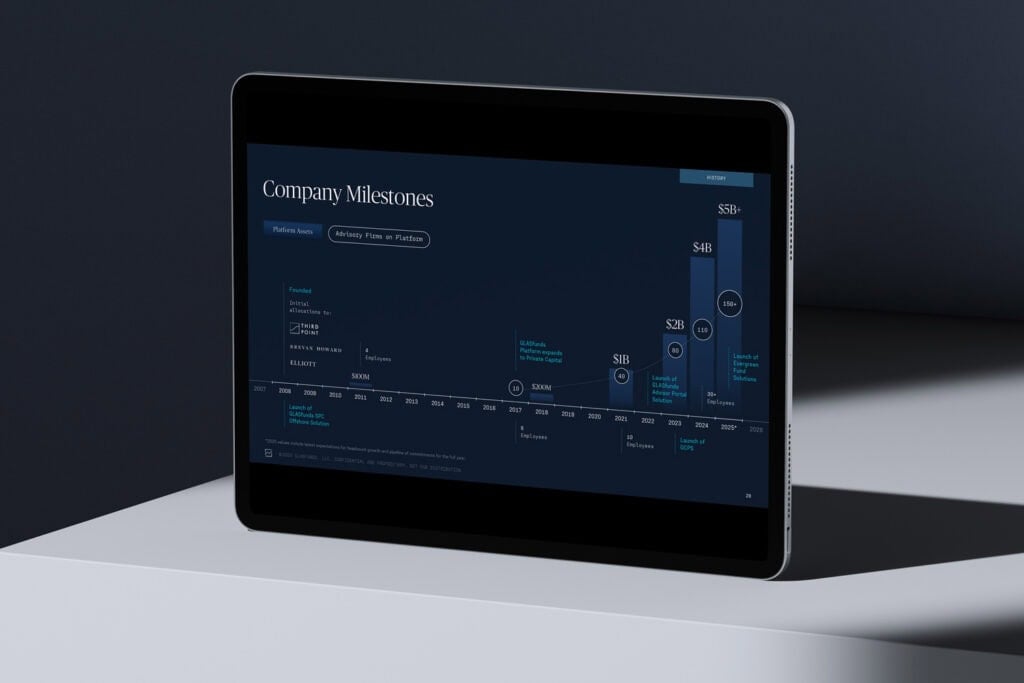
4. Timeline Infographics
Chart Your Path to Success with a Timeline
Timelines are a great tool for a number of things: to showcase critical industry events, chronicle your company’s achievements, or project future milestones. A timeline can effectively communicate your story, from inception to the present day, and outline a clear vision for the future.
Beyond simply listing dates, a well-crafted timeline demonstrates strategic foresight. It tells investors that you understand your market’s trajectory, have a proven record of execution, and possess a clear roadmap for future growth.
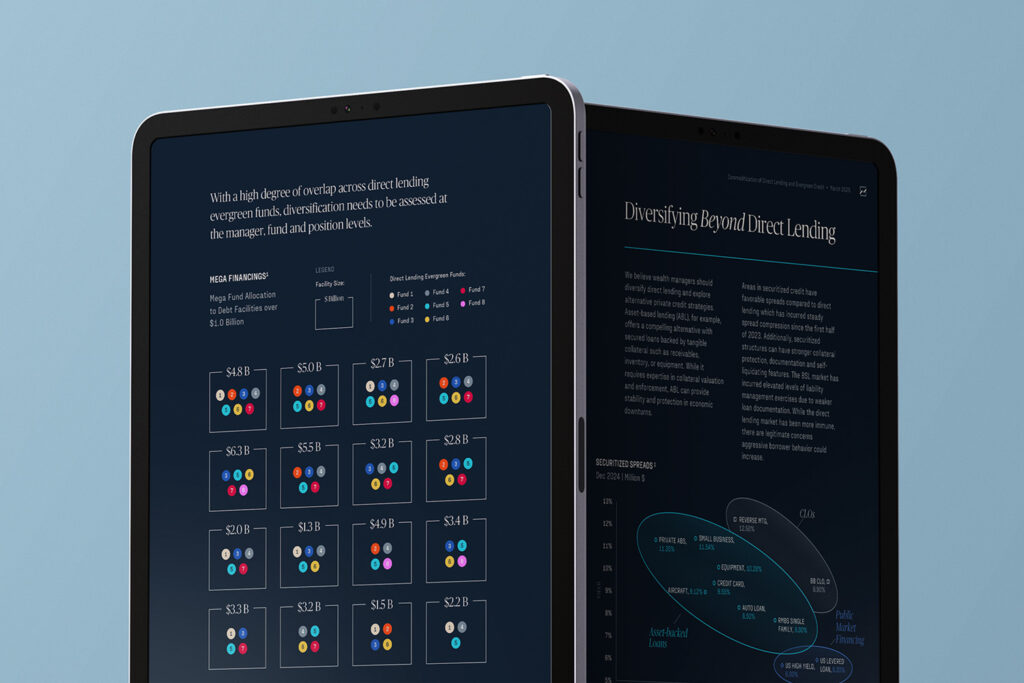
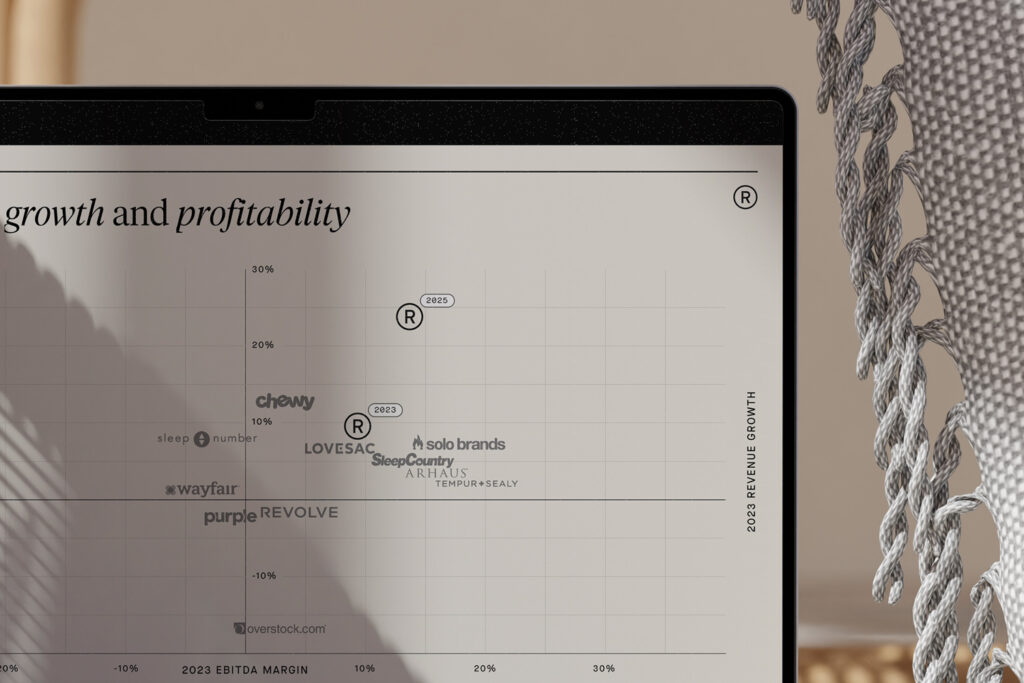
5. Matrix Models
Define Your Market Position with Matrix Models
These models are powerful tools for plotting a subject—such as your company, a product, or an entire market—against two competing variables. This is particularly effective for illustrating your competitive landscape.
By defining the axes of the matrix (e.g., Price vs. Quality, Innovation vs. Established Presence), you control the narrative. This allows you to visually carve out your unique space in the market, instantly showing investors where you excel and why your position is defensible. A classic example is the SWOT (Strengths, Weaknesses, Opportunities, Threats) analysis, which can be powerfully presented in a 2×2 matrix.
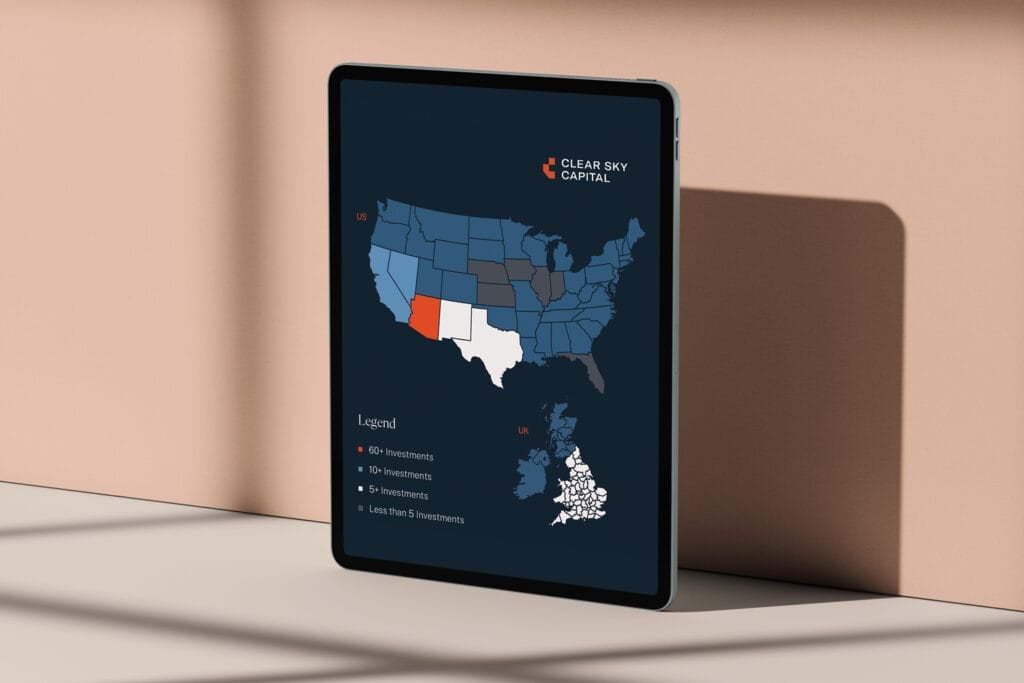
6. Maps
Illustrate Your Geographic Footprint with Maps
There are countless instances when locational data can support your business plan. Perhaps you have multiple facilities or storefronts around the nation – or the globe. Or maybe you find it useful to showcase global market activity. In any case, presenting this information directly on a map can be beneficial in that it gives your reader a clean snapshot of your company’s reach, or the impact of a particular market trend.
7. Process Infographics
Simplify Complexity with Process Infographics
If your core offering is a product or service with a multi-step user journey, a process infographic is essential. This is especially true for app or platform development. Visually guiding a reader through your software helps them understand your product in the most effective way possible – short of including a product demonstration in your business presentation.
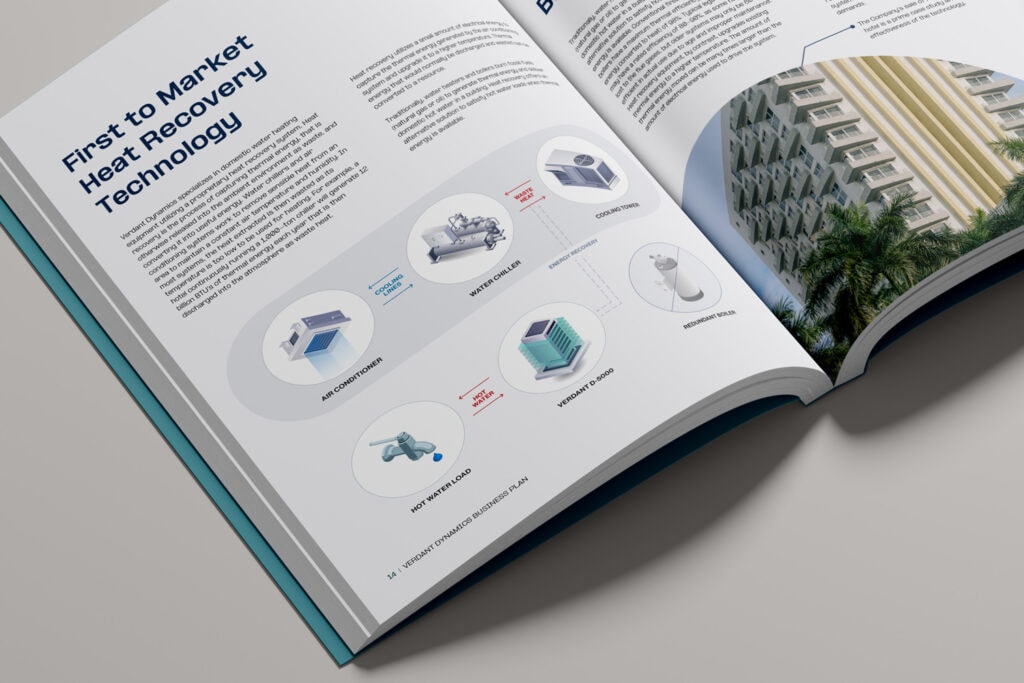
8. Anatomical Infographics
Deconstruct Your Value with Anatomical Infographics
In a similar vein, anatomical infographics are useful in instructing a reader on how something works, or what’s in a particular product (i.e., key ingredients) or market (i.e., top categories.) Both process and anatomical infographics help add an educational component to your business plan, which is incredibly useful when explaining the value of your product or business.

9. Comparison Infographics
Draw a Direct Comparison to Your Advantage
A comparison infographic is one of the most direct ways to assert your competitive edge. By placing your product, service, or methodology side-by-side with a competitor’s or an outdated industry standard, you can instantly highlight key differentiators. This format allows you to control the points of comparison, ensuring that your strengths—be it features, pricing, efficiency, or outcomes—are the central focus. For an investor, this provides a clear and immediate understanding of your unique value proposition.

10. Funnel Infographics
Visualize Your Customer Acquisition Strategy
A funnel infographic visually represents the journey a customer takes, from initial awareness to final purchase and retention. This is essential for demonstrating your sales and marketing strategy. By illustrating each stage of the funnel (e.g., Awareness, Interest, Decision, Action), you can assign key metrics and conversion rates, proving to investors that you have a deep understanding of your customer and a concrete plan for scalable growth. It shows you’re not just building a product, but also a system to attract and convert customers.
In Summary:
Business plans are important documents that serve to convey key information and data – from market trends and activity to projected revenue growth and return on investment.
In these instances, brevity and transparency are crucial – more so than superficial design elements. Infographics, when used strategically, enforce the former while maintaining the latter.
They improve the comprehension of your document while ensuring it is memorable and compelling. They help tell a story in a language the reader inherently understands – because that reader lives in a world where infographics are the native language of the modern world.
Your business model is innovative and forward-thinking. Your business plan must be as well.
References:
[1] Vogel, D. R., Dickson, G. W. & Lehman, J. A. (1986). Persuasion and the Role of Visual Presentation Support: The UM/3M Study.
[2] Wyble, B., Potter, M.C., Hagmann, C, & McCourt, E.S. (2013). Detecting meaning in RSVP at 13 ms per picture, Attention, Perception, & Psychophysics. 76, 2. 270–279.

Katya Polo
Katya Polo is the co-founder of Van York Agency. She specializes in high-level business plans, sales proposals and investor presentations, as well as graphic design and brand development. Since 2018, she has produced 200+ business plans and pitch decks to support fundraising efforts exceeding $3.45 billion in investment capital.
Sign up for emails on latest posts
Never miss an insight. We’ll email you when new posts are published.