
Infographic design offers a new way to communicate key information and insights. Educate and engage your audience with compelling visual content that leaves a lasting impression.
Infographic Design Services
Strategic Storytelling through Infographic Design
We dedicate ourselves to crafting and perfecting your story – to investors, partners and all important stakeholders along the way. Van York is founded on the idea that visual content, strengthened by executive-level analysis, empowers you to thrive in a new digital landscape. Using infographics as a catalyst for strategic storytelling, we work to ensure your story is heard by the audiences that matter most to you.
What are infographics?
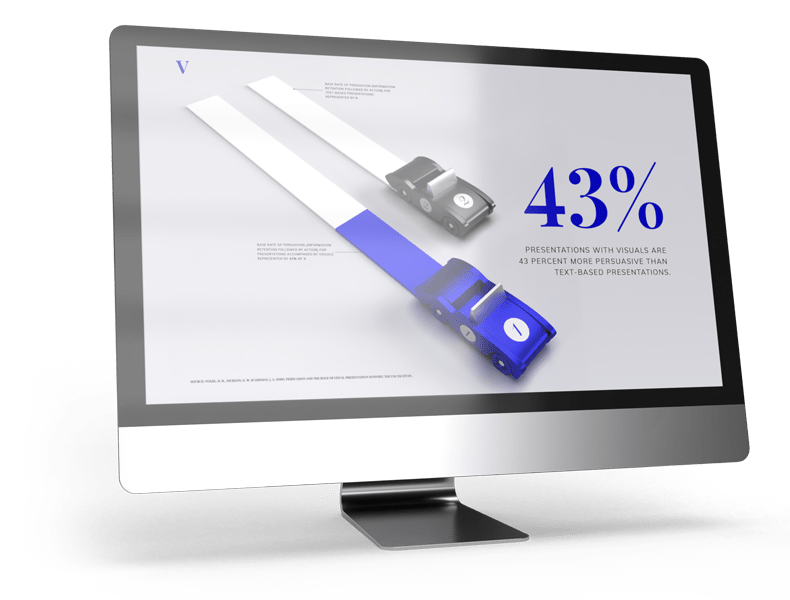
Infographics are graphic representations of narrow sets of data and information. They’re used to concisely relay key insights in an easily digestible, visual format. Infographic design often includes data visualization – traditional charts and graphs that interpret data through graphic elements such as size, colour or shape. Infographics are both an effective and engaging way to relay important information to your audience. This information can include financial projections, educational material, customer metrics, key market data and much more.
The Modern Approach to Market Research
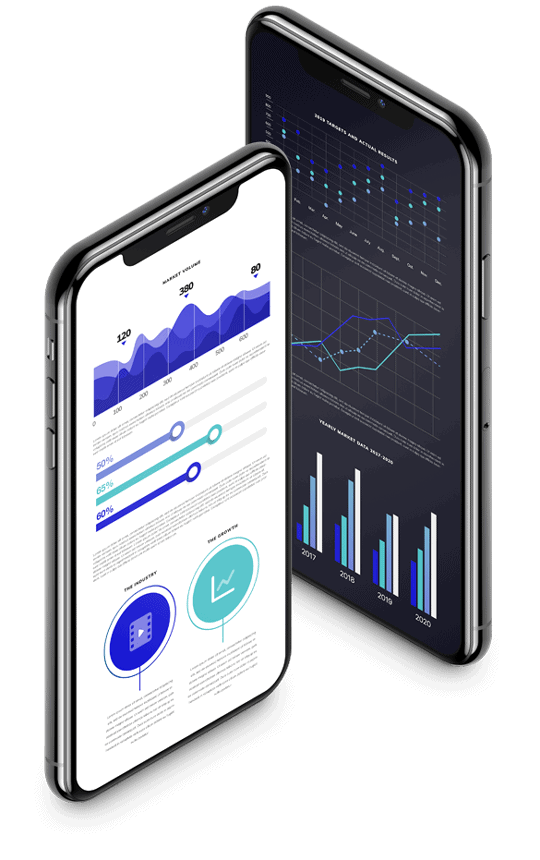
Market analysis is the backbone of a strong business plan or investor presentation. Investors want to be informed of the existing market data that supports your proposition, and the growing trends that underscore your competitive edge. Traditionally, investors would parse long reports on industry analysis – which in some cases, still has its place. But with the ever-growing amount of data consistently within reach, your information is in constant competition with various platforms and sources of content.
Using visual content can help you communicate important insights with your target audience, and infographics are an effective way to deliver that information. Leveraging creative visual content to illustrate your market analysis can maximize your potential of leaving a lasting impact with your investors.
Let’s Get Started
Are you looking to share some interesting insights with your target audience? We can help you tell your story in a unique and compelling way. Get in touch with us to speak with a consultant and start working with a multi-functional marketing agency.

