

5 Ways Visual Content Can Accelerate Your Marketing Strategy

By the time you finish reading this sentence, over 3 million Instagram stories will have been shared, 12 million text messages sent, and more than 170 million emails will have been delivered [1].
With over 5.4 billion global internet users [2] collectively generating more than 140 zettabytes (140 trillion gigabytes) of data each year [3], your message is fighting for attention. To cut through the noise, engaging visual content isn’t just an option—it’s your most powerful strategic tool.
For this reason, it’s important to revisit the ways in which we communicate—from the way we articulate our investor presentations to the way we structure our email campaigns. Adapting a marketing strategy that prioritizes visual content, data visualization, and other media is essential for remaining competitive and publishing memorable material.
With cave paintings dating back tens of thousands of years [4], using visual communication is not a revolutionary idea. Today, new scientific theories help us understand why it’s so prevalent and effective. In this post, we look at five remarkable metrics pertaining to visual processing and audience retention and discuss how they can be applied to your marketing strategy.
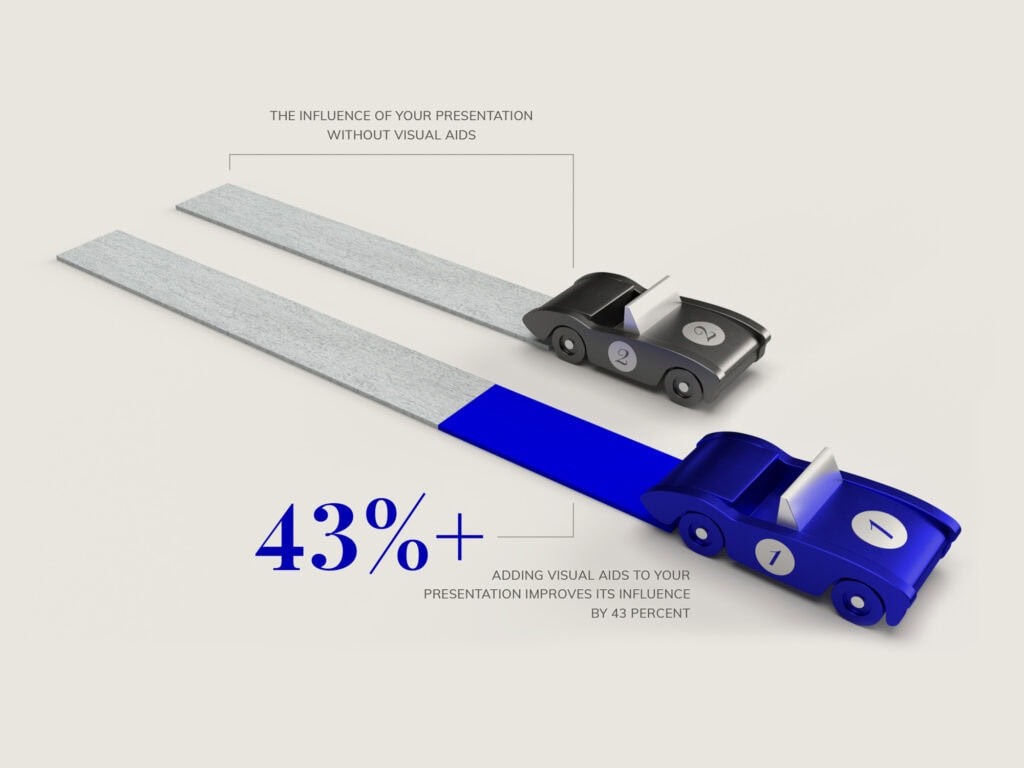
1. Visuals in Presentations
Presentations with visuals are 43% more persuasive than text-based presentations.
A foundational study conducted by researchers from the University of Minnesota and 3M Corporation found that presentations using visual aids (colourful charts, graphs, and images) were 43% more persuasive than black-and-white, text-based presentations [5].
WHAT IT MEANS FOR YOUR BUSINESS
A strong business plan does more than present data; it tells a compelling story. Use visuals to transform complex information into a clear, persuasive narrative that anticipates and answers investor questions, making your proposal not just informative, but undeniable.
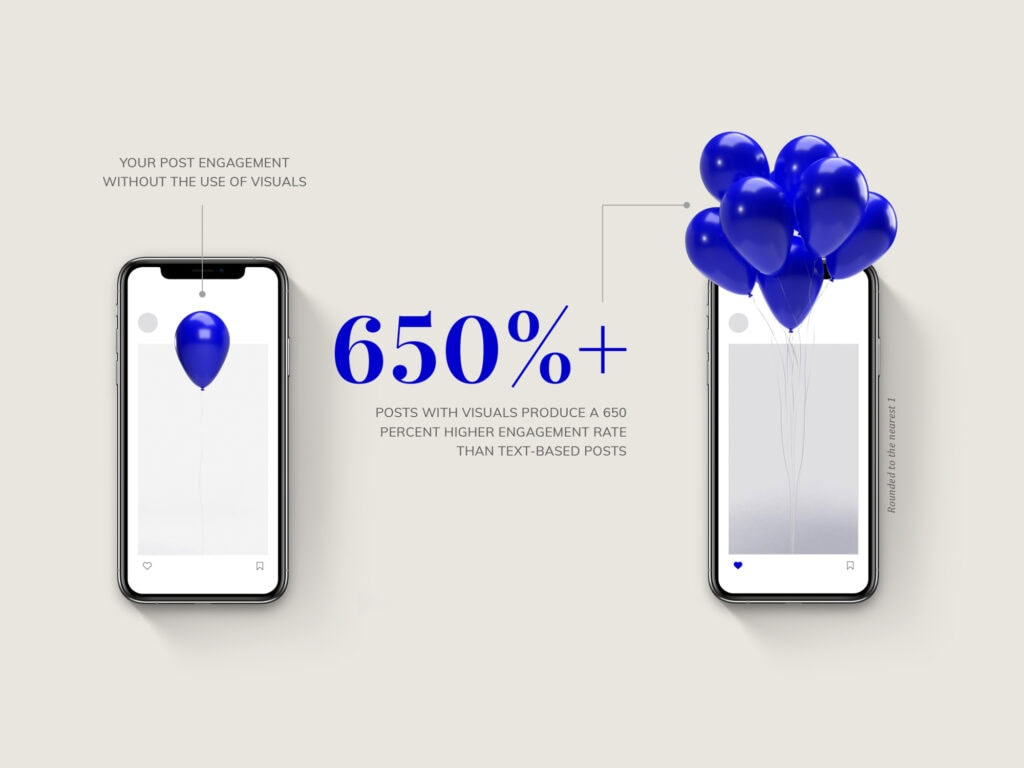
2. Visuals in Social Posts
Posts with visuals produce significantly higher engagement than text-only posts.
While specific metrics vary by platform, a consistent trend is clear: content paired with relevant visuals yields dramatically higher engagement. For example, social media posts with images see over 65% more engagement than their text-only counterparts [6].
WHAT IT MEANS FOR YOUR BUSINESS
Modern audiences don’t read; they scan. A 2008 study found that users read only about 20% of the words on an average webpage [7]. Conversely, MIT researchers have found that the human brain can process an entire image in as little as 13 milliseconds [8]—about 10 times faster than the blink of an eye [9]. This explains why visual posts perform so well. Prioritize visual content in your social media and email campaigns to capture attention instantly and drive interaction.
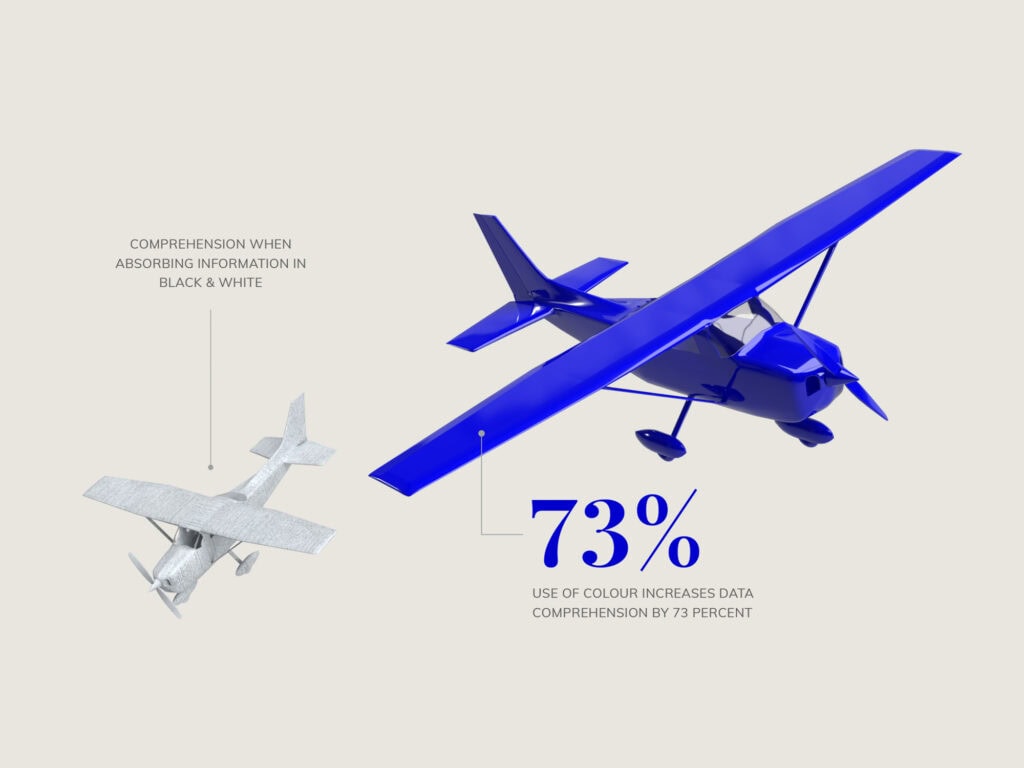
3. Colour Theory
Colour can increase brand recognition by up to 80%.
Research confirms that a signature colour can increase brand recognition by up to 80% [10]. This is because colour is processed by the brain more immediately than intricate logos or text, creating powerful, lasting associations that build brand equity.
WHAT IT MEANS FOR YOUR BUSINESS
Colour is a strategic tool, not just an aesthetic choice. Every hue carries psychological weight that influences emotion and consumer behaviour. A study published in the journal Management Decision found that people often make a subconscious judgment about a product within 90 seconds of first seeing it, and that up to 90% of that assessment is based on colour alone [10]. When developing your brand identity, pitch decks, or product packaging, leverage colour theory to not only attract attention but also to build immediate brand recognition and evoke the precise emotional response that drives your message home.
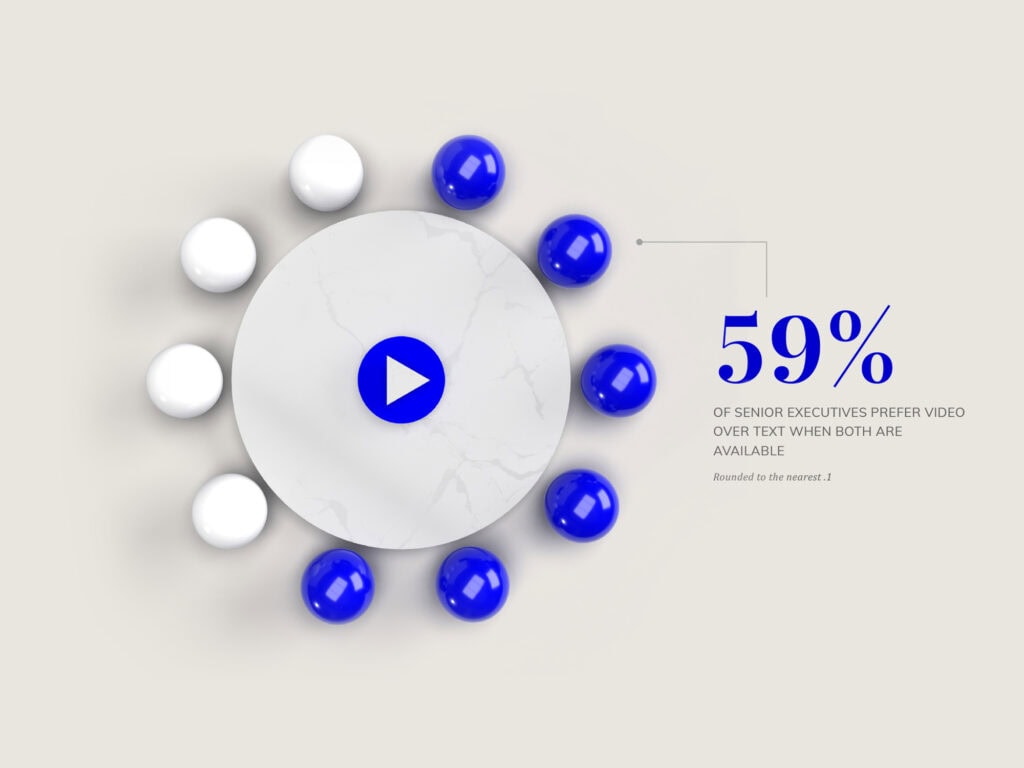
4. Video Engagement
73% of senior executives prefer to watch a video over reading text when learning about a product or service.
A 2022 study by Forbes found that when information is available in both video and text, a strong majority of executives (73%) opt for video content [11].
WHAT IT MEANS FOR YOUR BUSINESS
{When both are offered, executives consistently choose video over text. This preference for efficient, engaging content extends from the C-suite to your entire audience. In fact, 91% of businesses now use video as a core marketing tool [12]. From animated explainer videos to product demos, video is a primary visual communication channel. Integrate it into your strategy to educate, influence, and command attention in any setting.}
5. Discerning Audiences
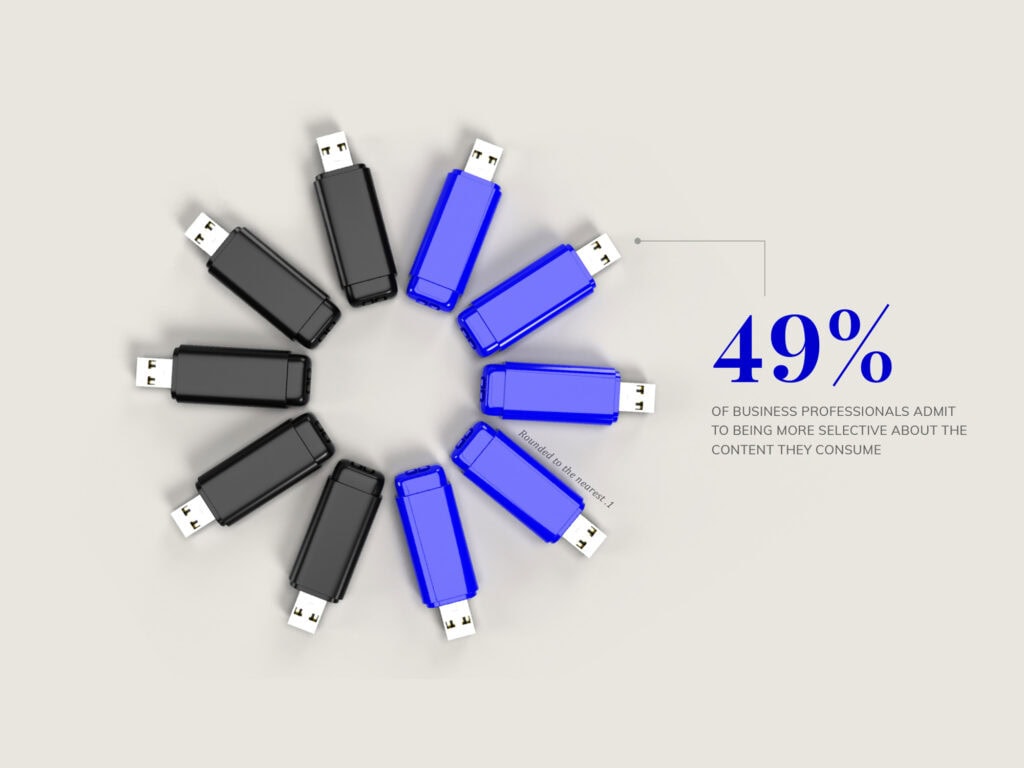
Captivating content is necessary to hold the attention of today’s discerning audience.
According to Prezi’s 2018 State of Attention Report, nearly half of all business professionals admit to being more selective about the content they choose to consume [13]. Once engaged, 59% of respondents claim they can give a piece of content their undivided attention.
WHAT IT MEANS FOR YOUR BUSINESS
Attention is not a given; it’s earned. In an environment where multitasking is the norm, your audience is constantly deciding if your content is worth their focus. Don’t let them choose their inbox over your pitch. Command the room by delivering value through compelling, memorable visuals. The same study found that 79% of respondents believe animated visuals help keep audiences engaged, and separate research confirms that visuals are far more memorable than text [14]. When preparing for an important meeting, remember that each person in the room is making a choice to listen—make sure your presentation is compelling enough to earn it.
In Summary:
The most effective communication doesn’t just present information; it anticipates and answers the fundamental questions of your audience: “Why should I care?” “Why should I invest?” The key is to deliver these answers in a format that is not only understood but remembered. Visual content—from a sharp infographic to a dynamic video—is the most potent vehicle for achieving this. Make it the cornerstone of your marketing strategy to ensure your message is not just seen, but felt and acted upon.
REFERENCES (Updated 2025):
[1] “Data Never Sleeps 11.0” Report (2023). DOMO.
[2] “Number of internet users worldwide as of January 2024.” Statista.
[3] “Volume of data/information created, captured, copied, and consumed worldwide from 2010 to 2022, with forecasts from 2023 to 2025.” Statista.
[4] Gunn, R., David, B., Delannoy, J.J. & Katherine, M. (2017). The past 500 years of rock art at Nawarla Gabarnmang, central-western Arnhem Land, The Archeology of Rock Art in Western Arnhem Land, Australia. 303-328.
[5] Vogel, D. R., Dickson, G. W. & Lehman, J. A. (1986). Persuasion and the Role of Visual Presentation Support: The UM/3M Study.
[6] “The Ultimate List of Social Media Statistics for 2023.” Hubspot.
[7] Weinreich, H., Obendorf, H., Herder, E. & Mayer, M. (2008). Not Quite the Average: An Empirical Study of Web Use, ACM Transactions on the Web, Vol. 2.
[8] Wyble, B., Potter, M.C., Hagmann, C, & McCourt, E.S. (2013). Detecting meaning in RSVP at 13 ms per picture, Attention, Perception, & Psychophysics. 76, 2. 270–279.
[9] Bristow, D., Haynes, J.D., Sylvester, R., Frith, C., & Rees, G. (2005). Blinking suppresses the neural response to unchanging retinal stimulation, Current Biology. 15, 4.
[10] Singh, S. (2006). Impact of color on marketing. Management Decision, Vol. 44 No. 6, pp. 783-789.
[11] Video Marketing For Small Business: The Ultimate Guide (2022).” Forbes.
[12] Wyzowl’s “The State of Video Marketing 2024” report.
[13] Lacerdino, I. (2019). 2018 State of Attention. Prezi.
[14] Stenberg, G. (2006). Conceptual and perceptual factors in the picture superiority effect. European Journal of Cognitive Psychology. 1-35.

Katya Polo
Katya Polo is the co-founder of Van York Agency. She specializes in high-level business plans, sales proposals and investor presentations, as well as graphic design and brand development. Since 2018, she has produced 200+ business plans and pitch decks to support fundraising efforts exceeding $3.45 billion in investment capital.
Sign up for emails on latest posts
Never miss an insight. We’ll email you when new posts are published.