

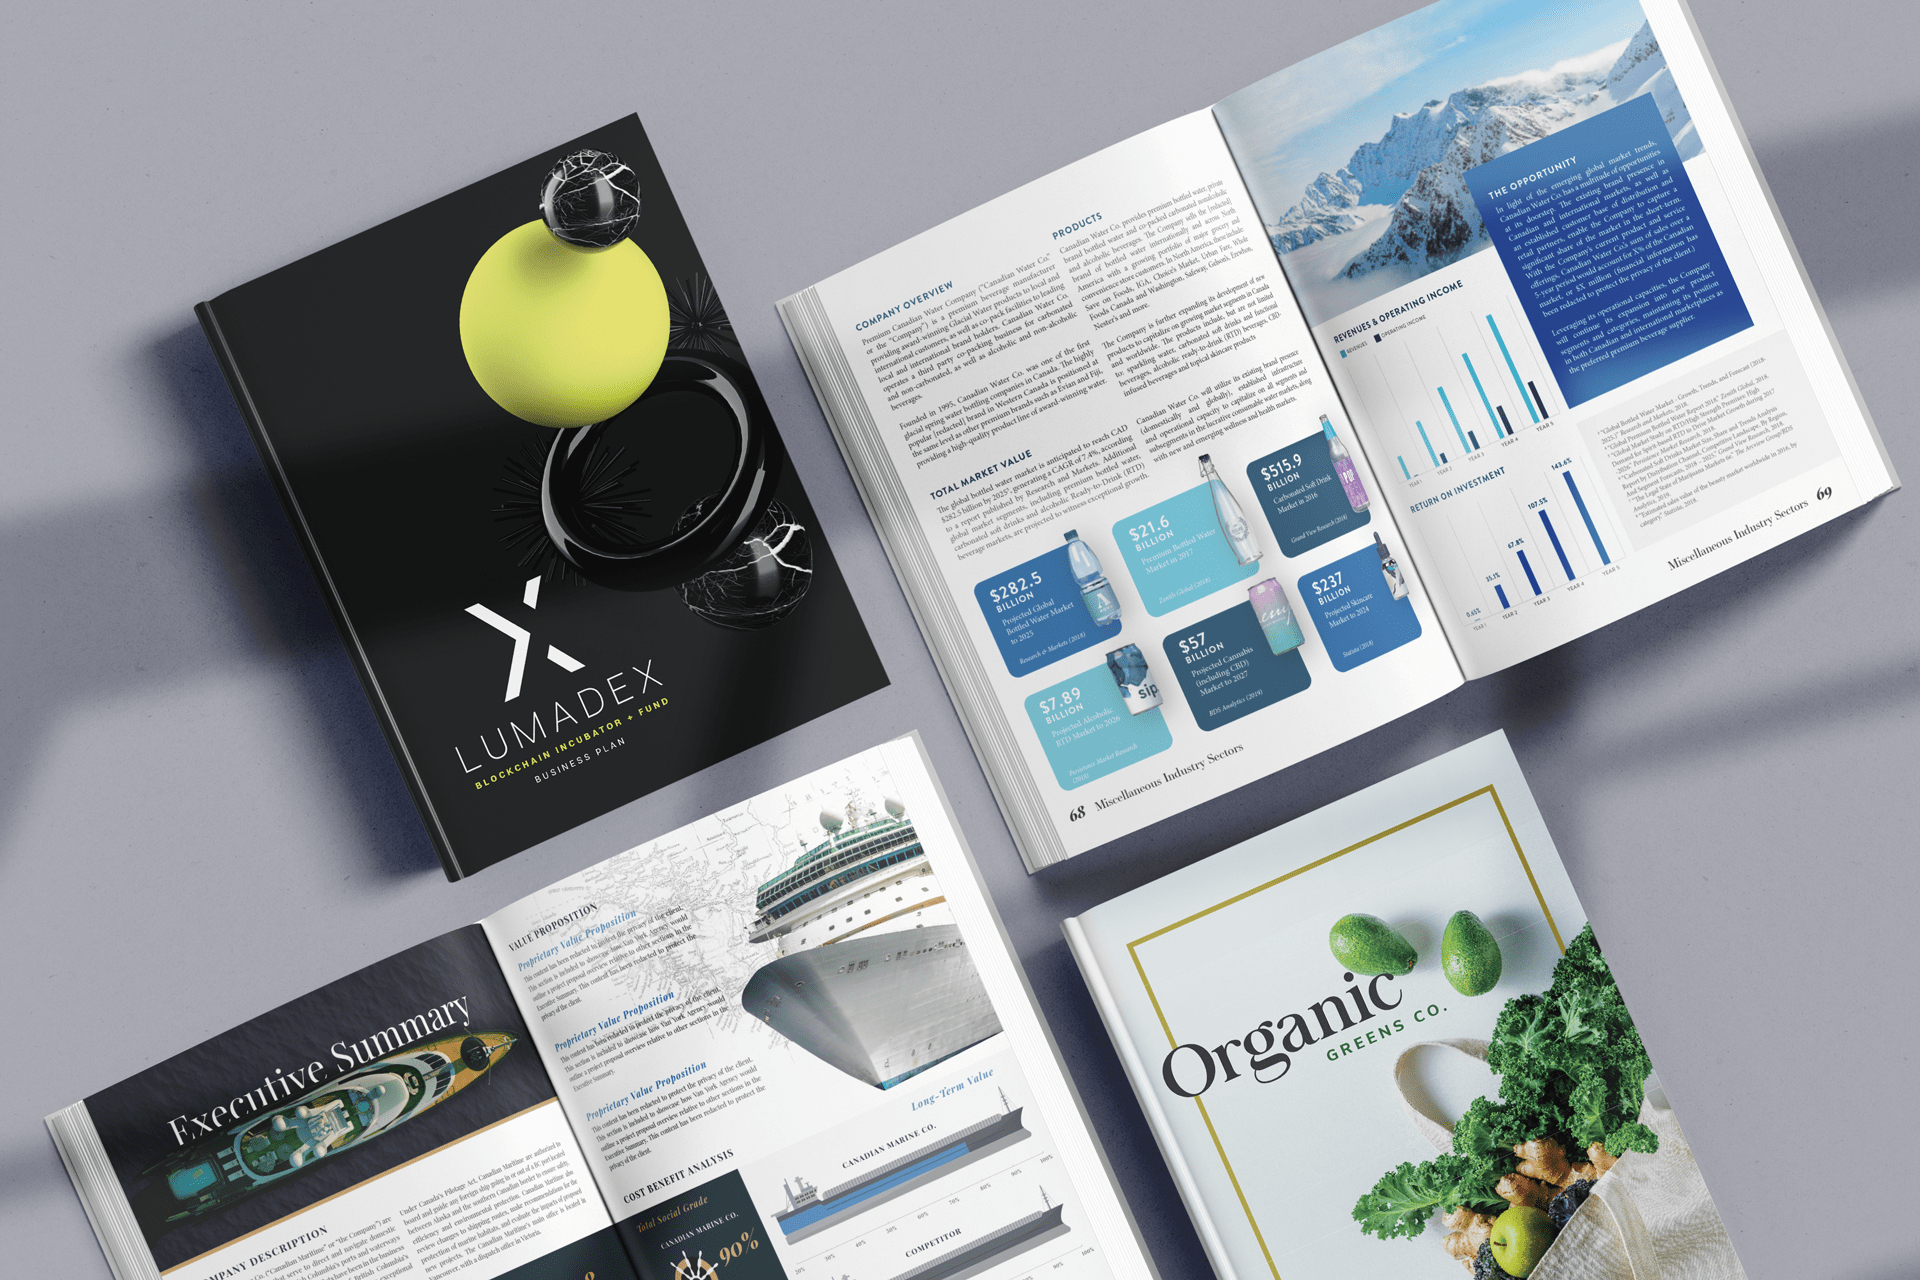
Infographics are a powerful communication device. They can simplify complex data, organize critical information and are more persuasive than text1. For these reasons, infographics should not be treated as non-essential accessories to your business plan – they should be an integral part of your business plan.
Infographics are defined as visuals or images (such as charts and diagrams) that are used to represent data or information. Think about your relationship with infographics: Traffic signs. Web browser icons. Election maps. In the last week, you’ve likely absorbed more information through infographics than you have through text-based material. And because we can process visuals 10 times faster than we blink2, it’s sometimes lost on us how ubiquitous infographics actually are.
As a founder or business development professional, you’ll find yourself tasked with putting together a business plan and/or pitch deck to raise capital – documents that exist to relay critical information and demonstrate your value. Strategically-designed infographics can transform a business plan from a generic proposal to a high-impact marketing document.
In this article, we break down the ten unique ways you can use infographics to strengthen your business plan.
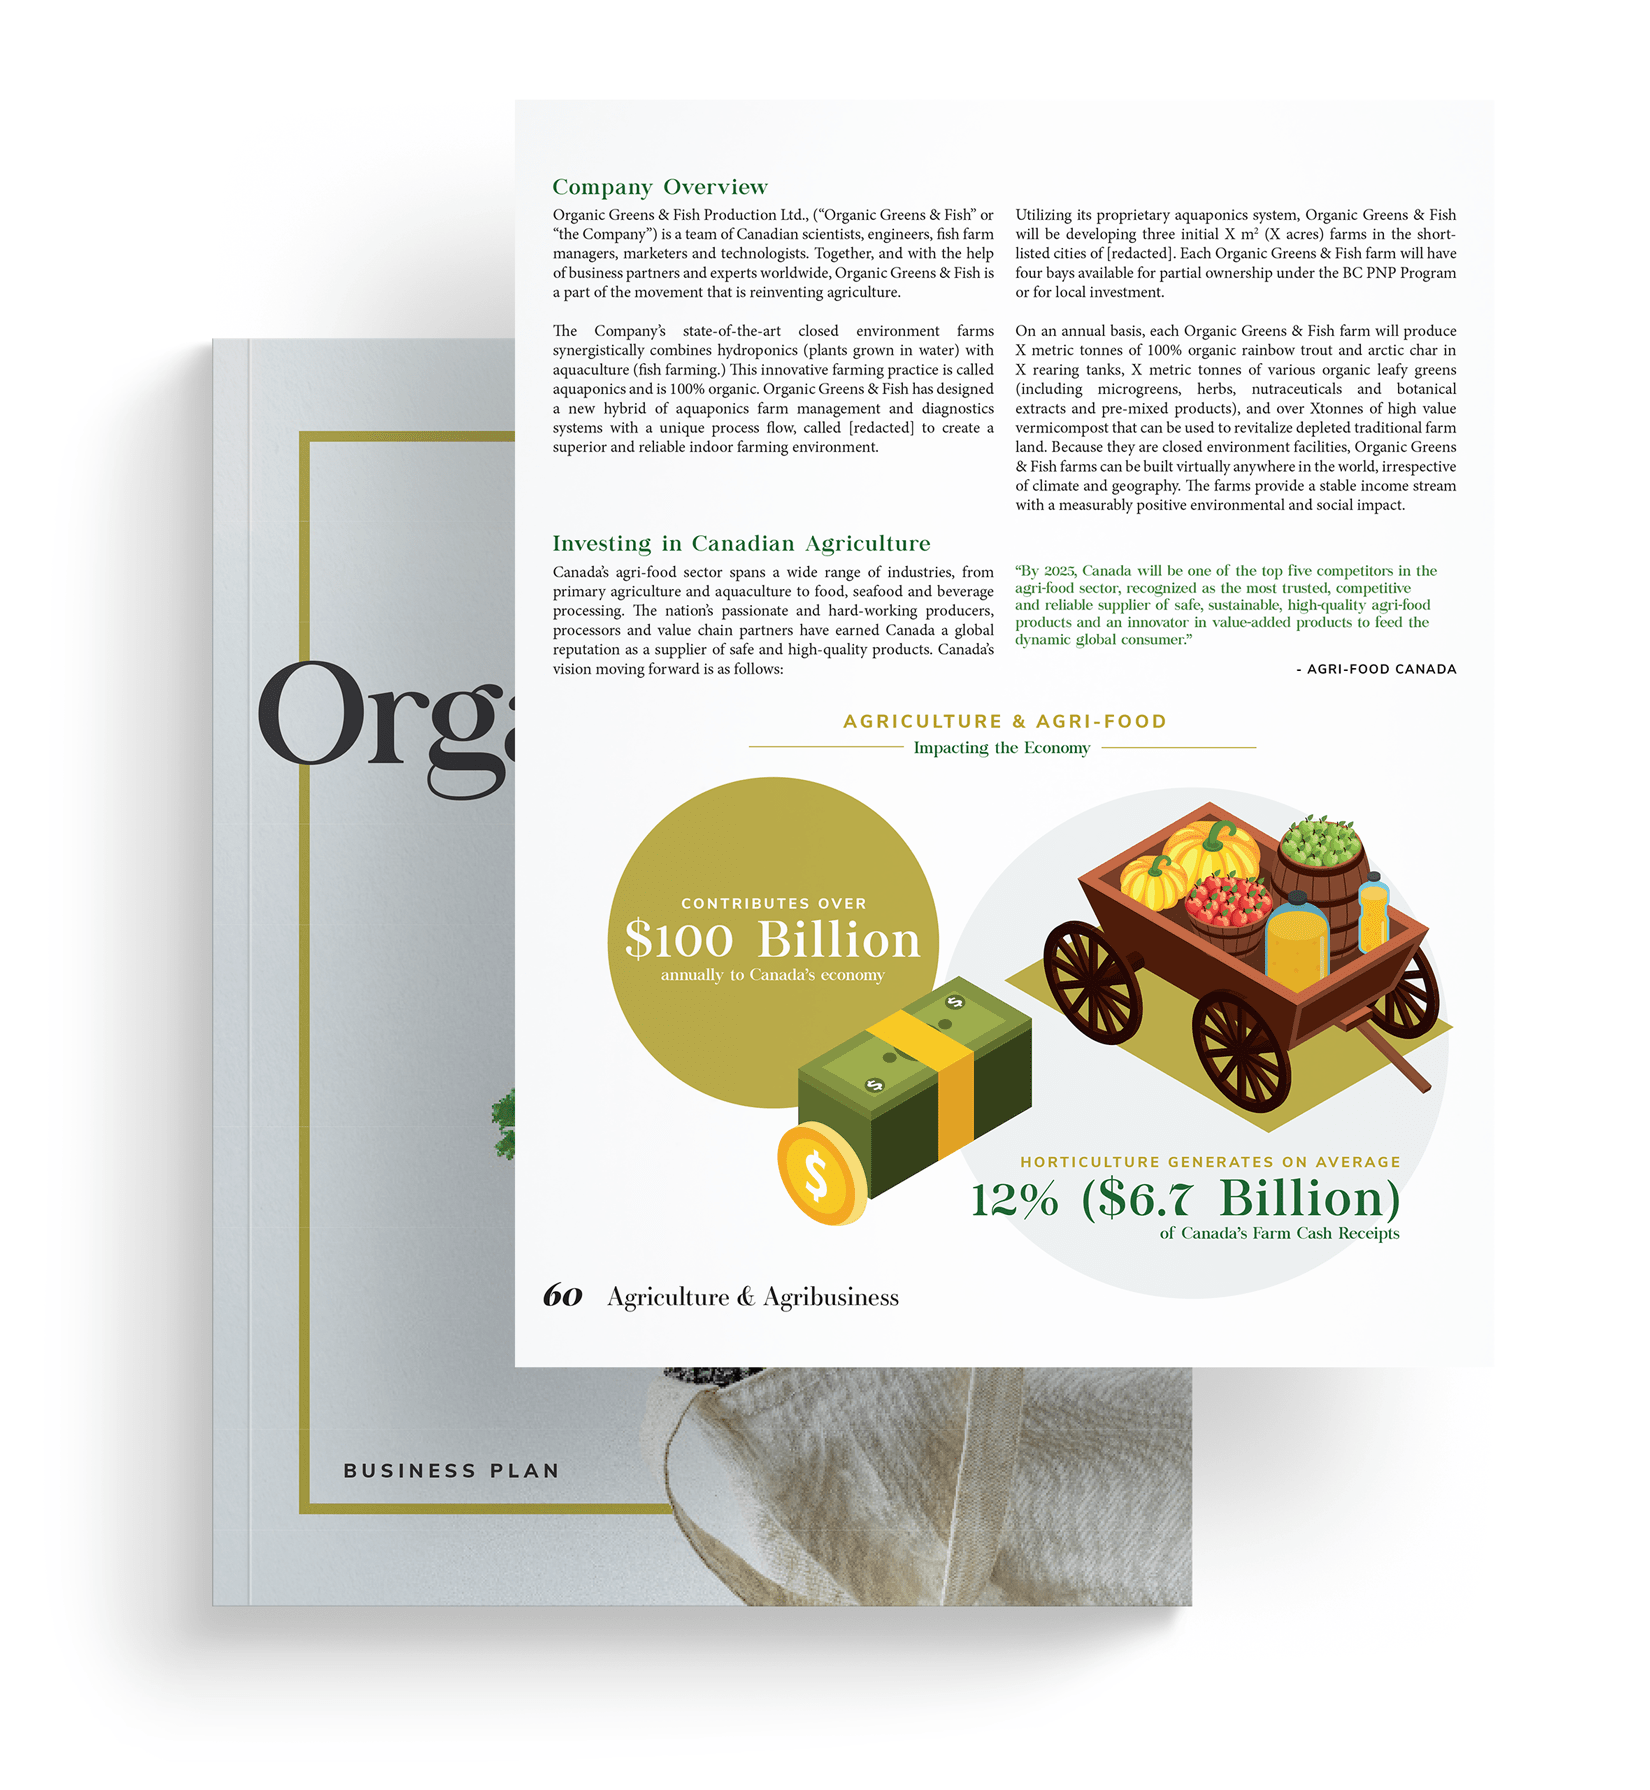
1. Statistical infographics can emphasize essential market data in your business plan
When compiling market research that supports your business plan, you might find a handful of key statistics you want to emphasize. These could be financial data reported within your specific industry or the growth rates across your different revenue streams.

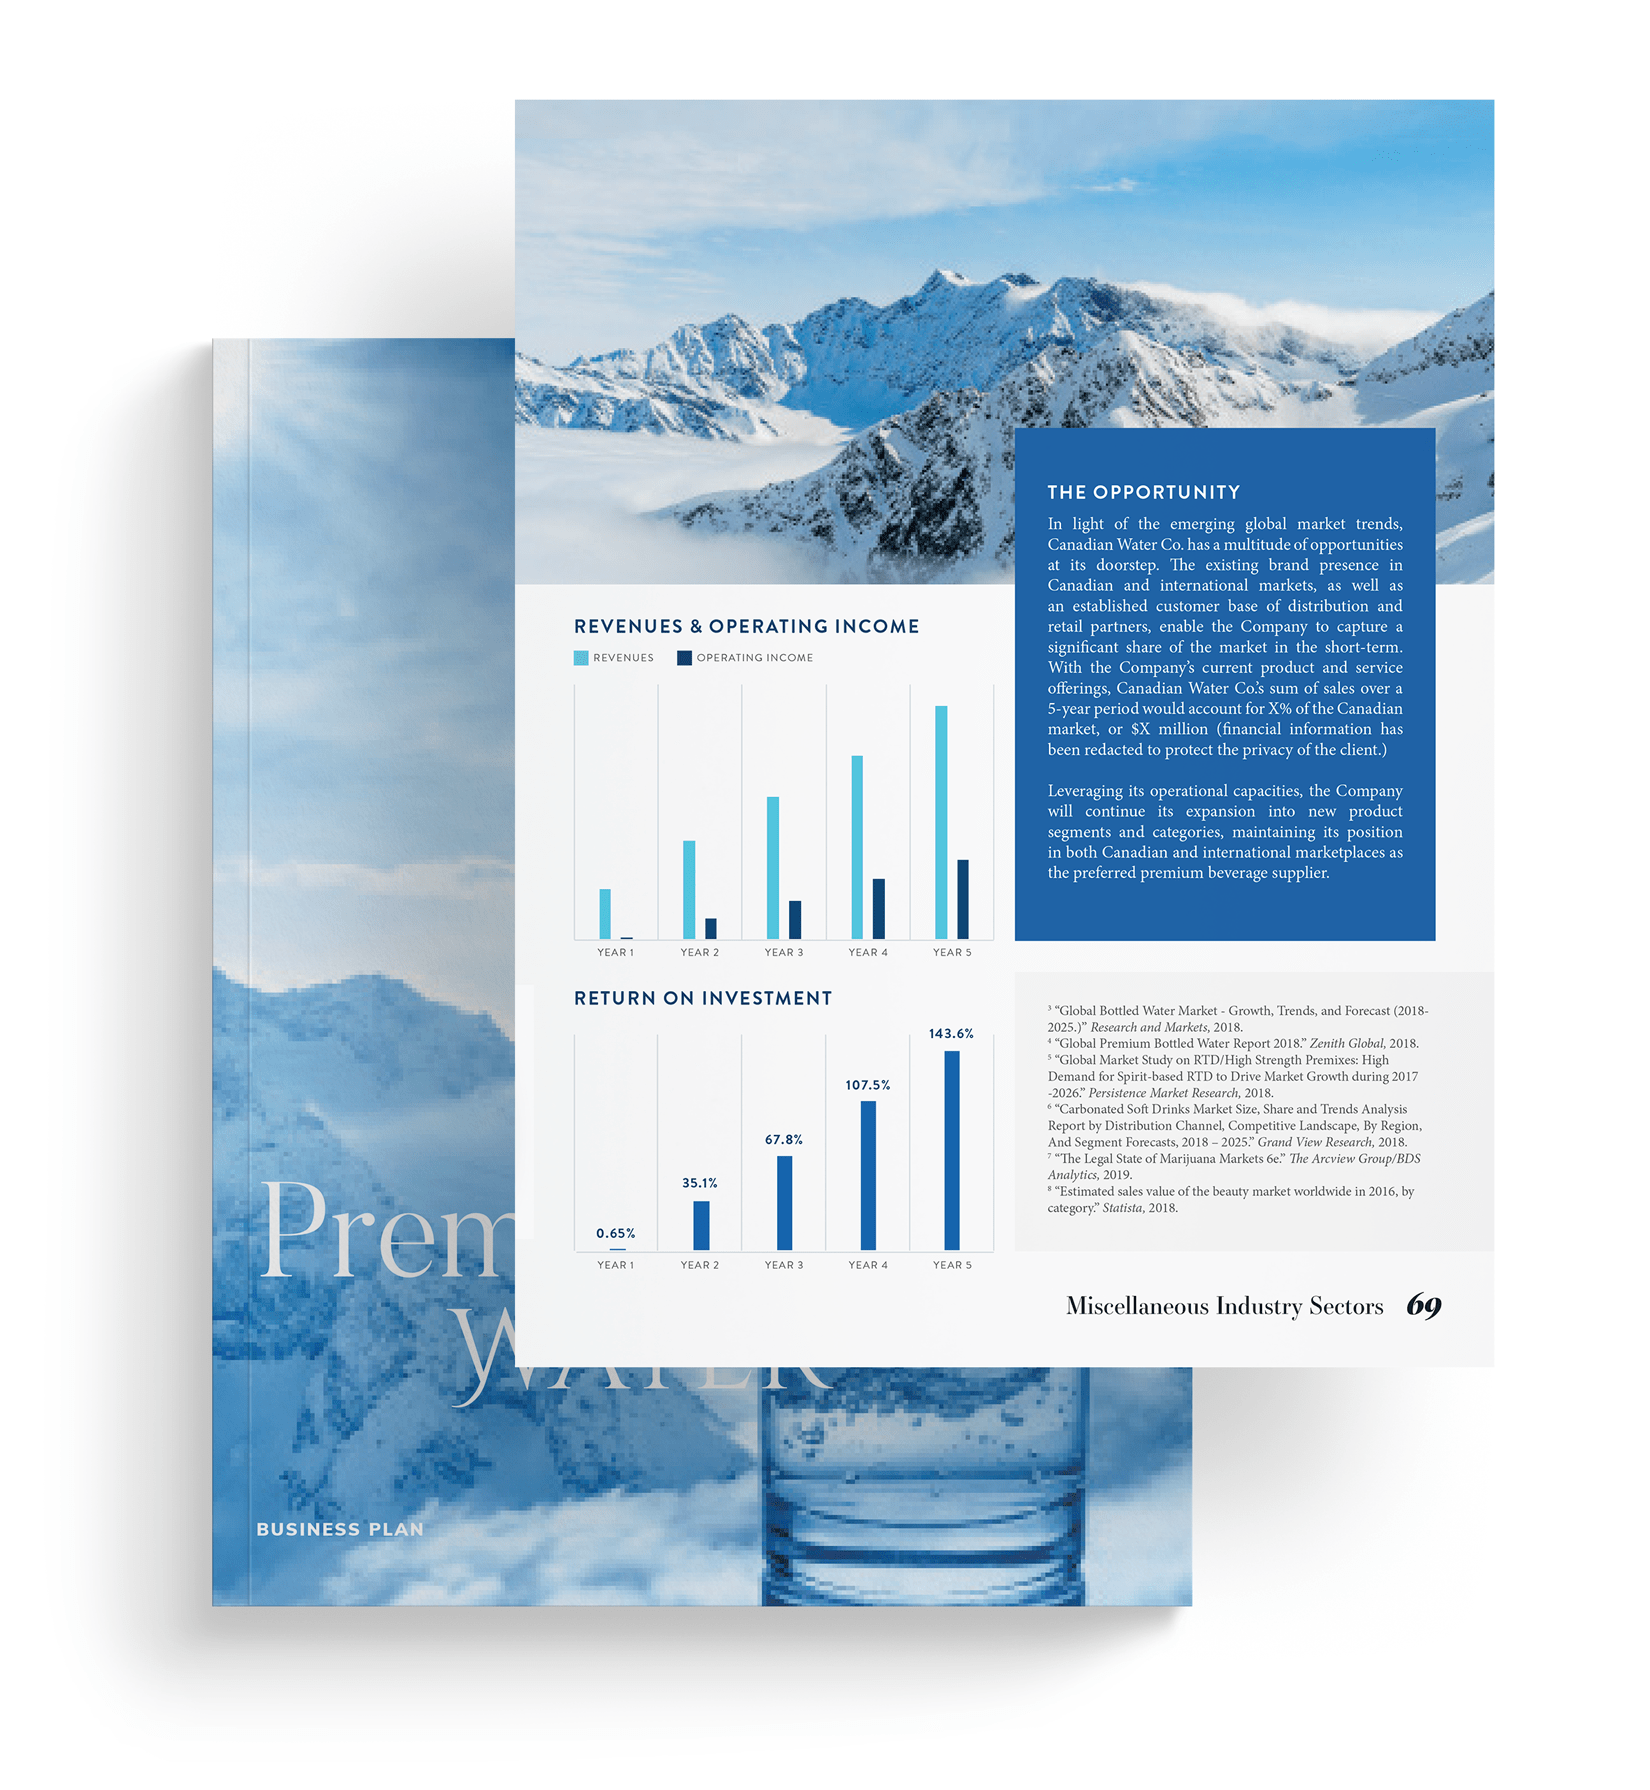
2. Charts and graphs show data in an easy-to-read, visual format
For many of us, charts and graphs are a no-brainer when it comes to relaying data in a business plan. Consider sprucing up the standard MS Word graphs by adjusting the colours to match your branding or increasing the size of figures you wish to highlight.
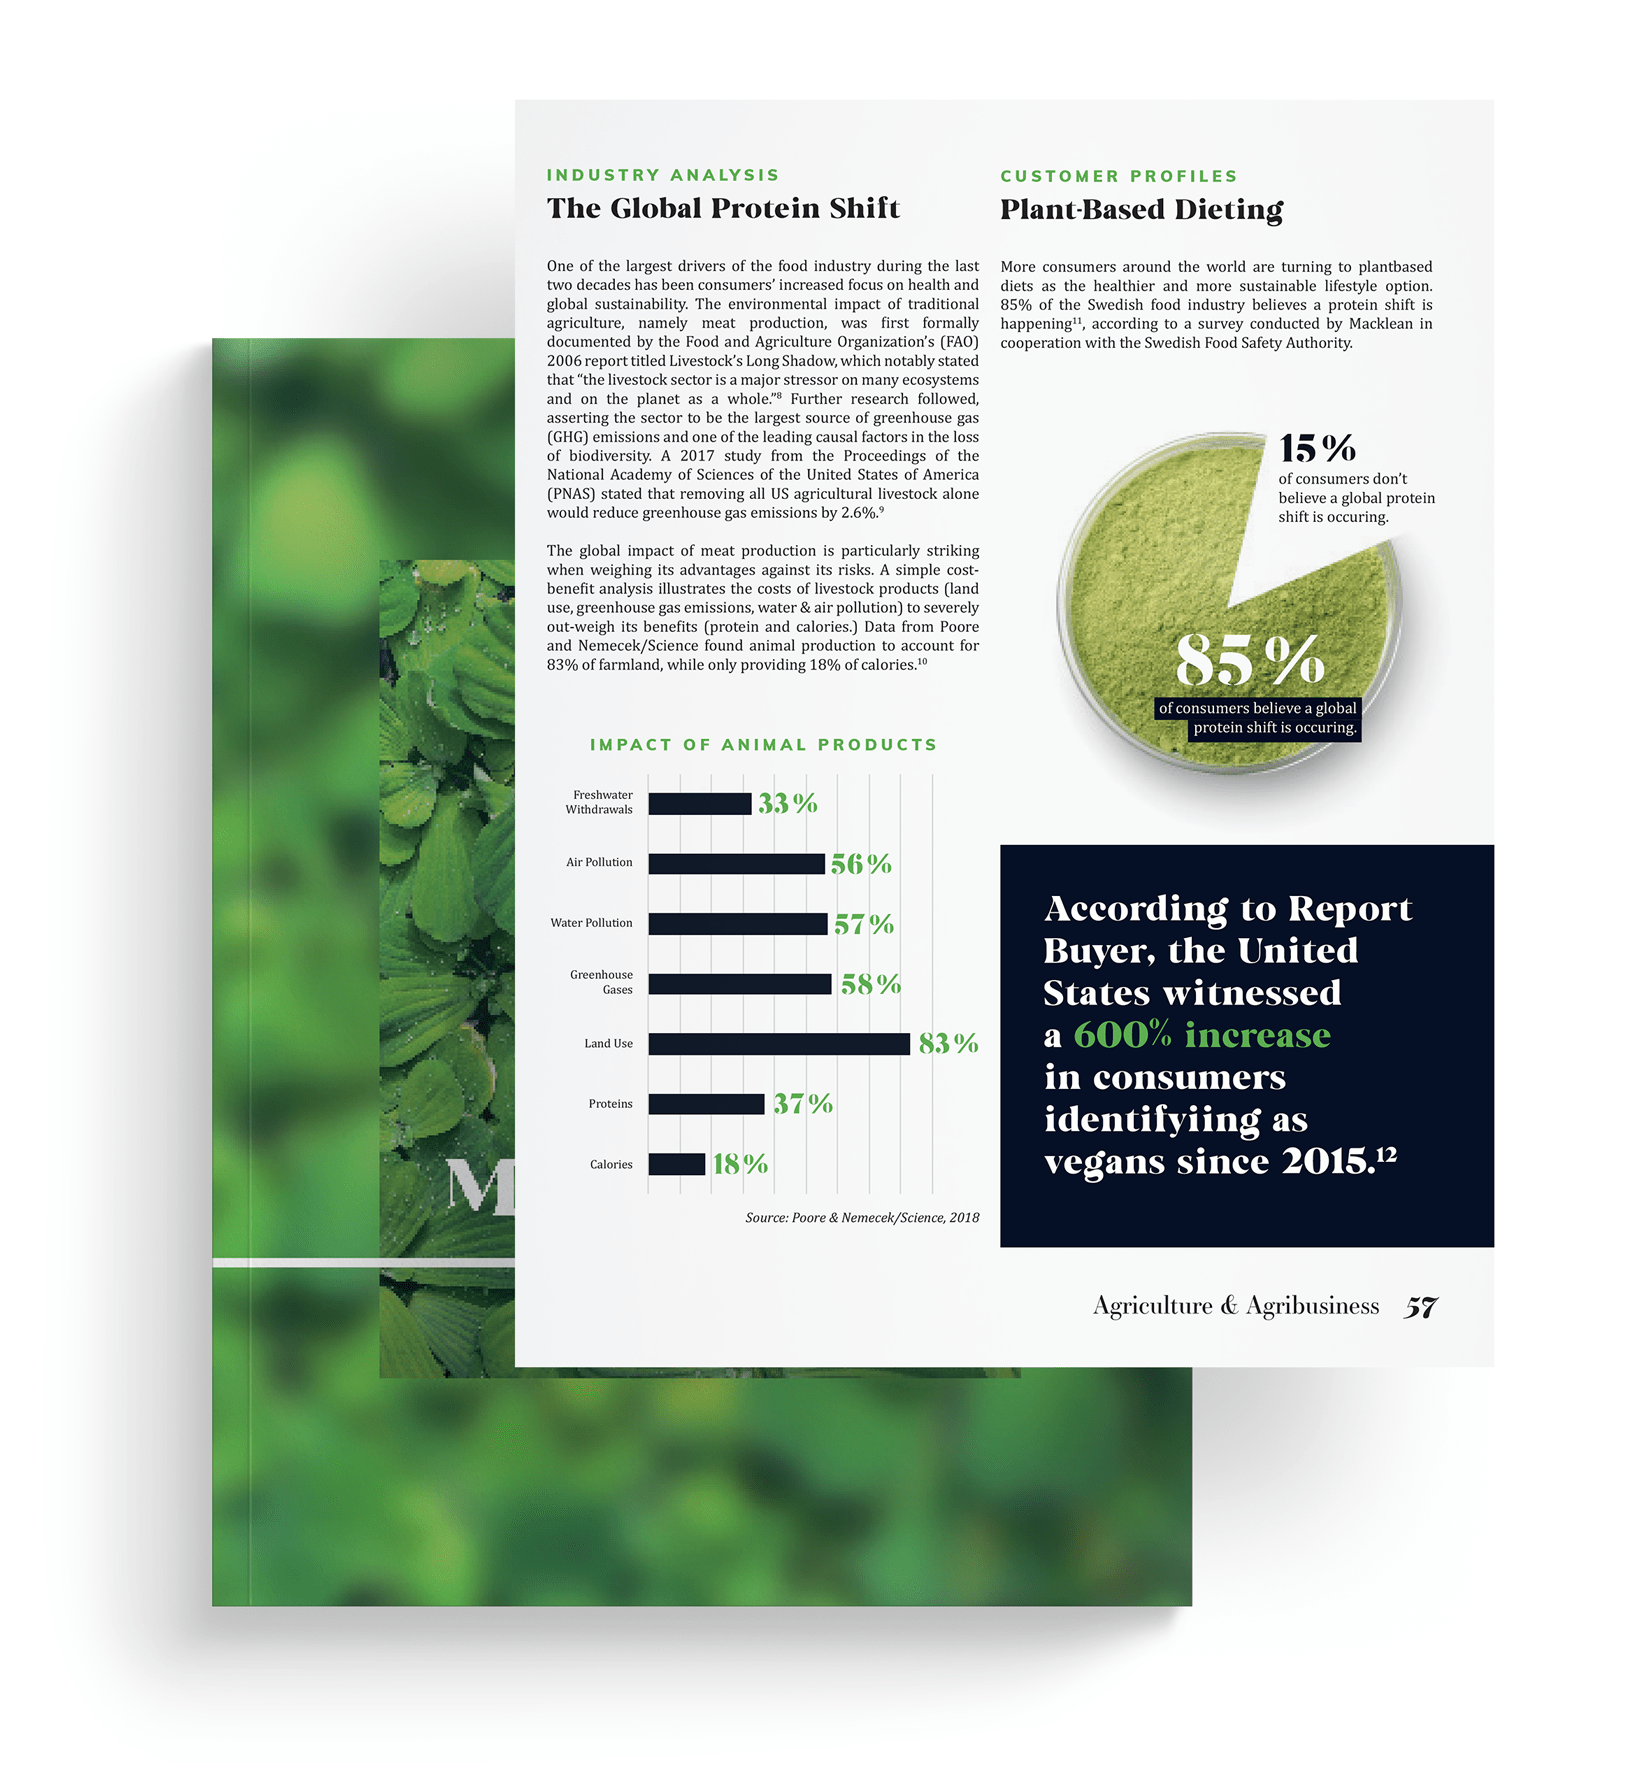
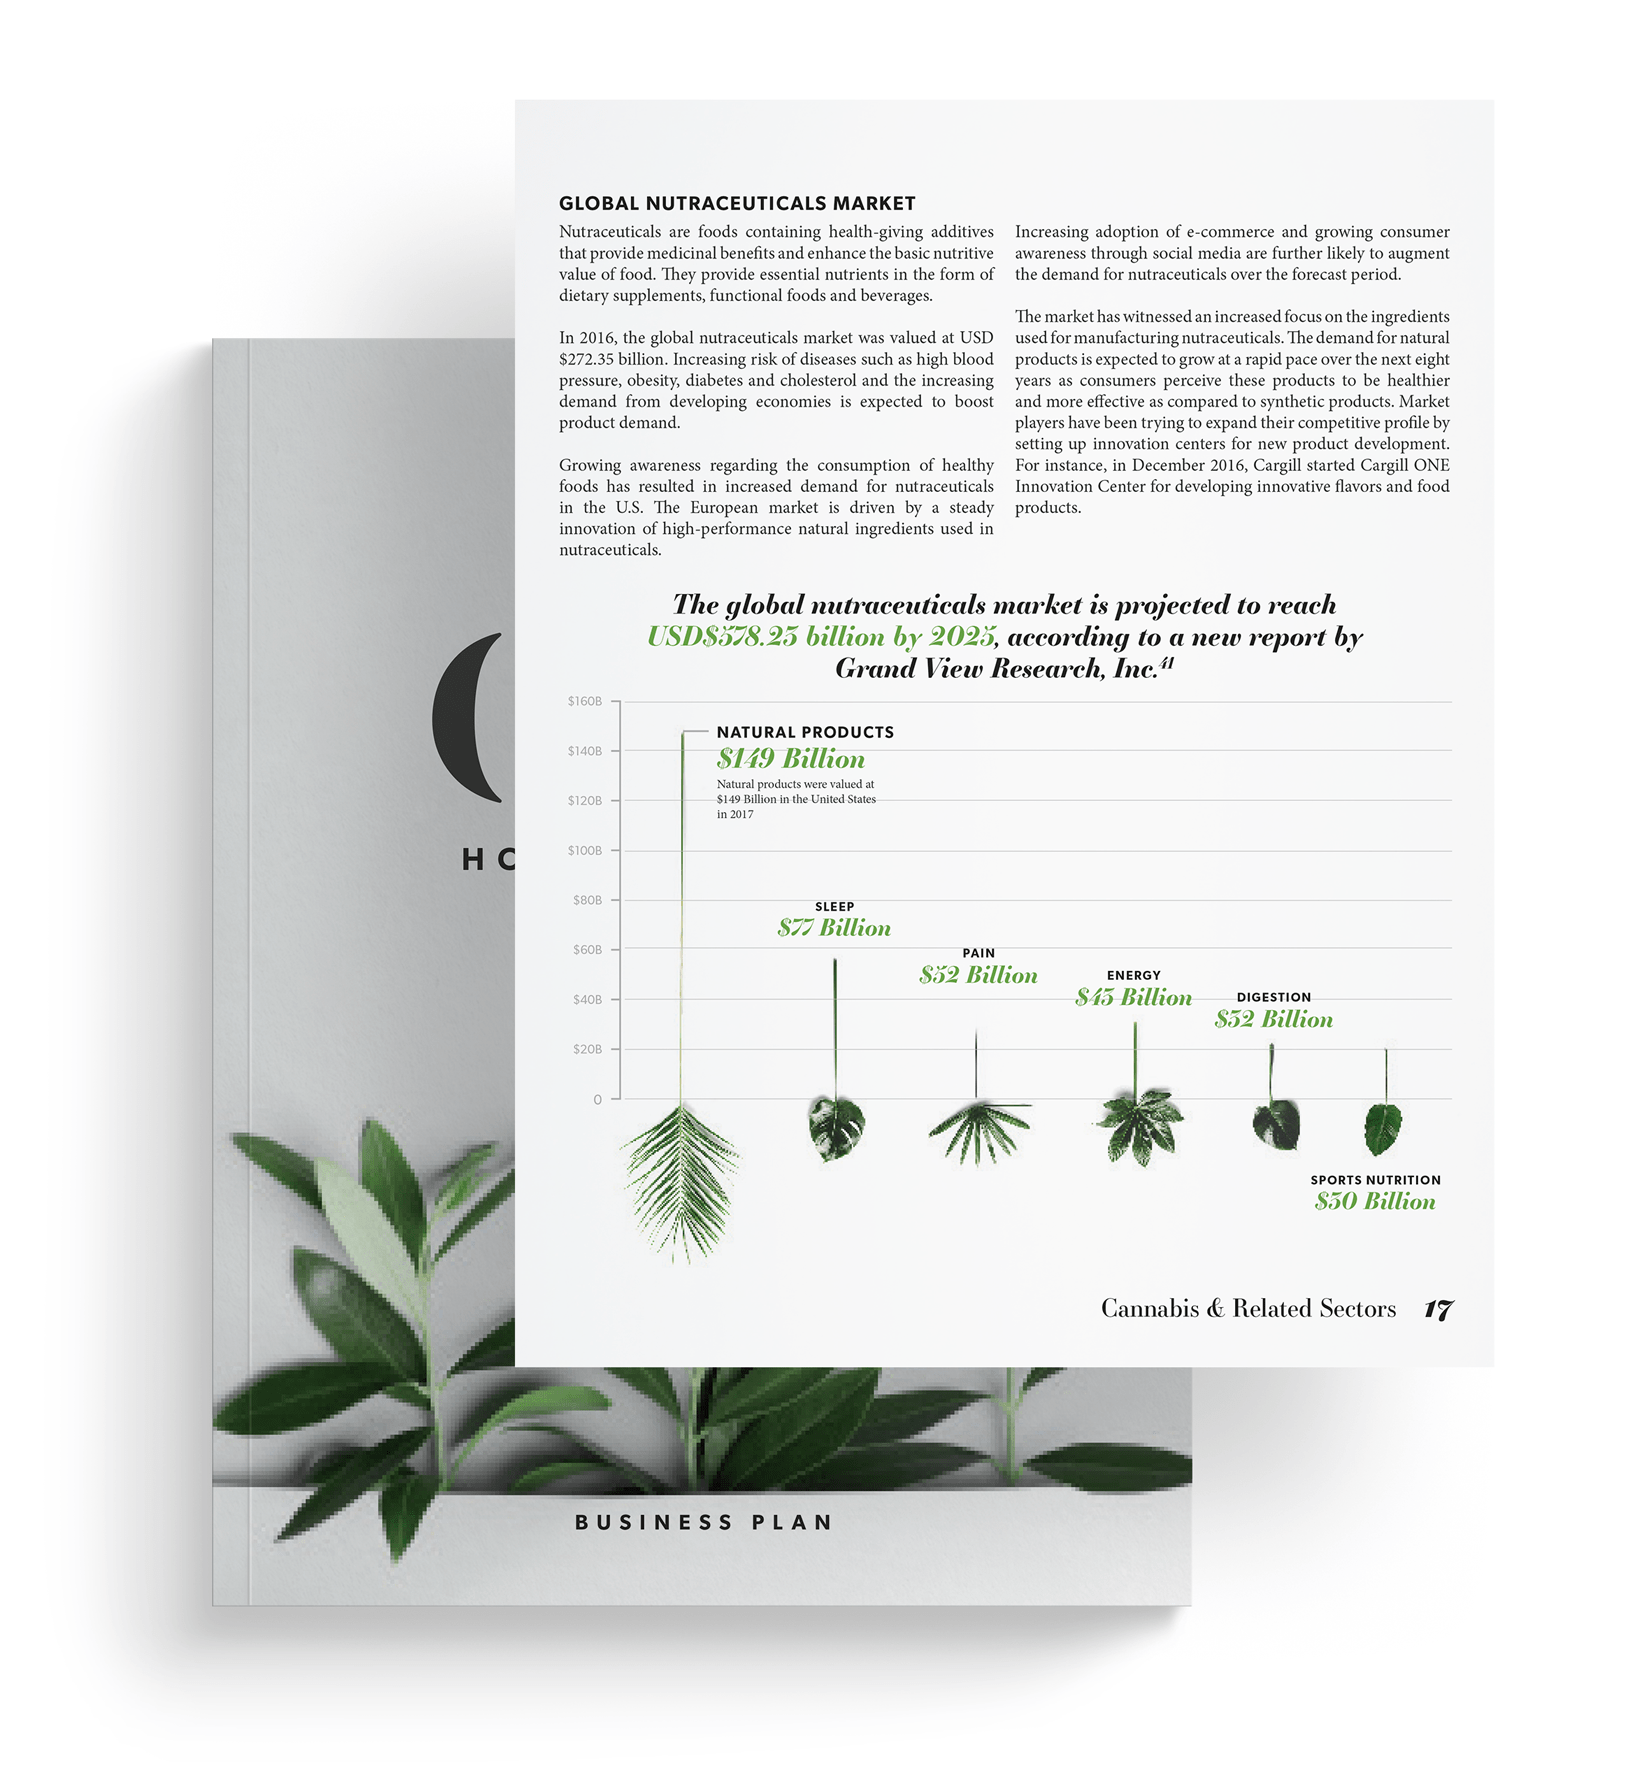
3. Data visualization is a creative way to increase the retention of key information
Charts and graphs are not the only way to convey important information. A more compelling and memorable approach would be to use visual aids to creatively explain the data. For example, if you want to illustrate the growth of your industry over a 5-year period, consider using a visual element (that’s relevant to your industry) that increases in size at the same CAGR (compound annual growth rate.) (Be careful to monitor the accuracy of your infographic. An inaccurate data visualisation is just a superfluous graphic.)

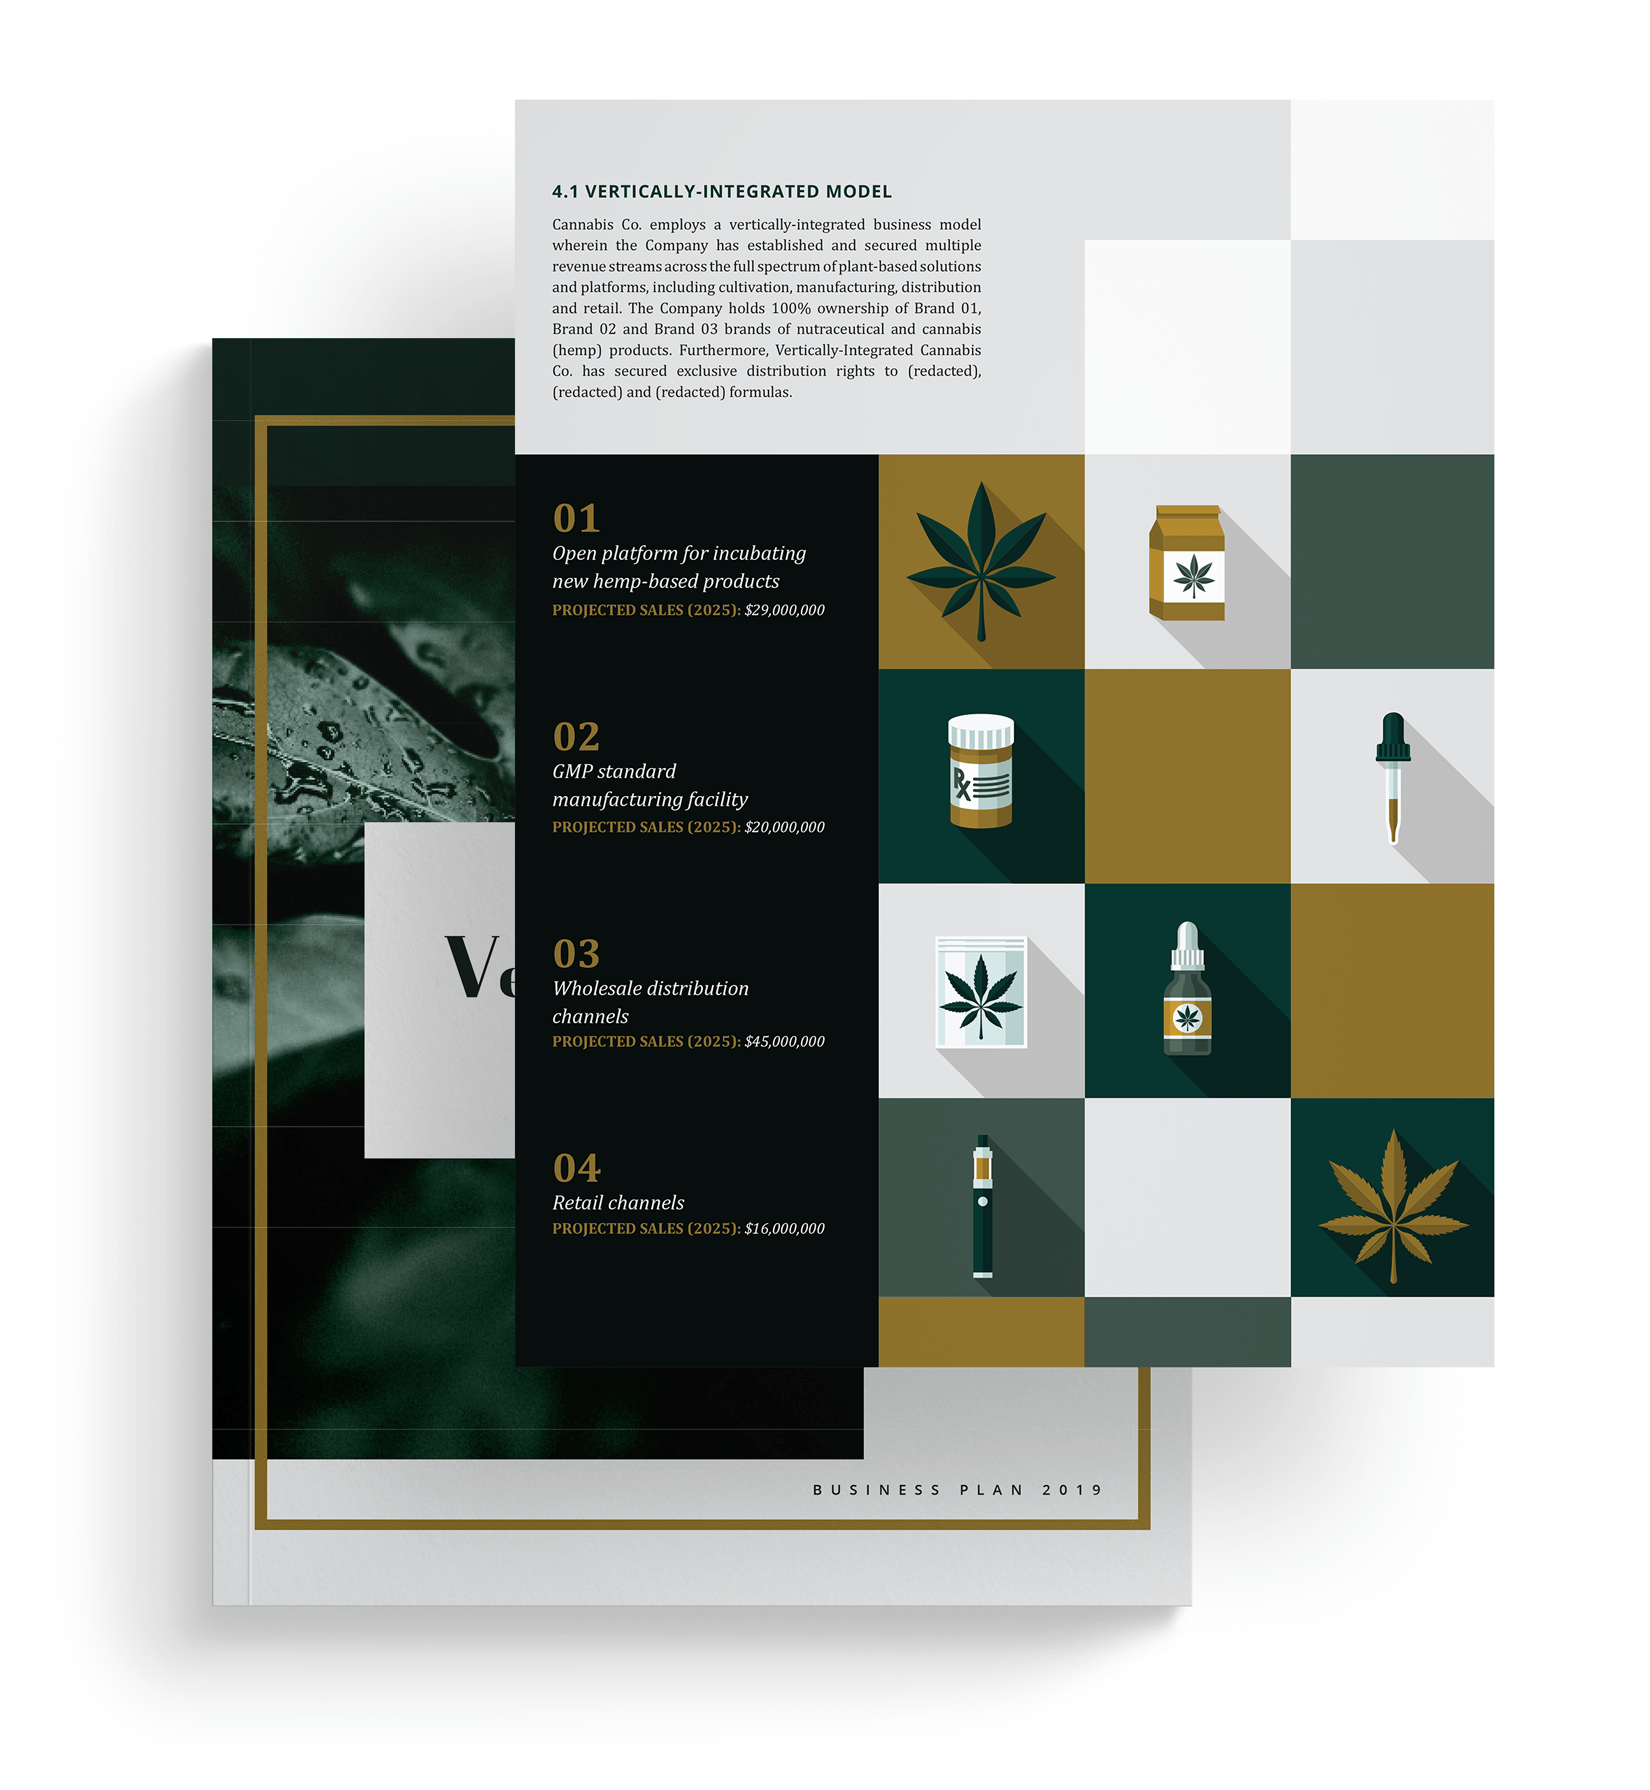
4. Infographics offer an alternative way to illustrate your business model
One of the essential questions your business plan will address is “how are you generating revenue?” or “how will you generate revenue?” You could opt for a simple table or a bullet-point list, or even reserve it for your financial projections chapter. But considering just how instrumental this information is, it may be worth your while to make your revenue model a focal point with an infographic. This helps establish your position early in the document, and it helps your reader better visualize the important elements of your business.

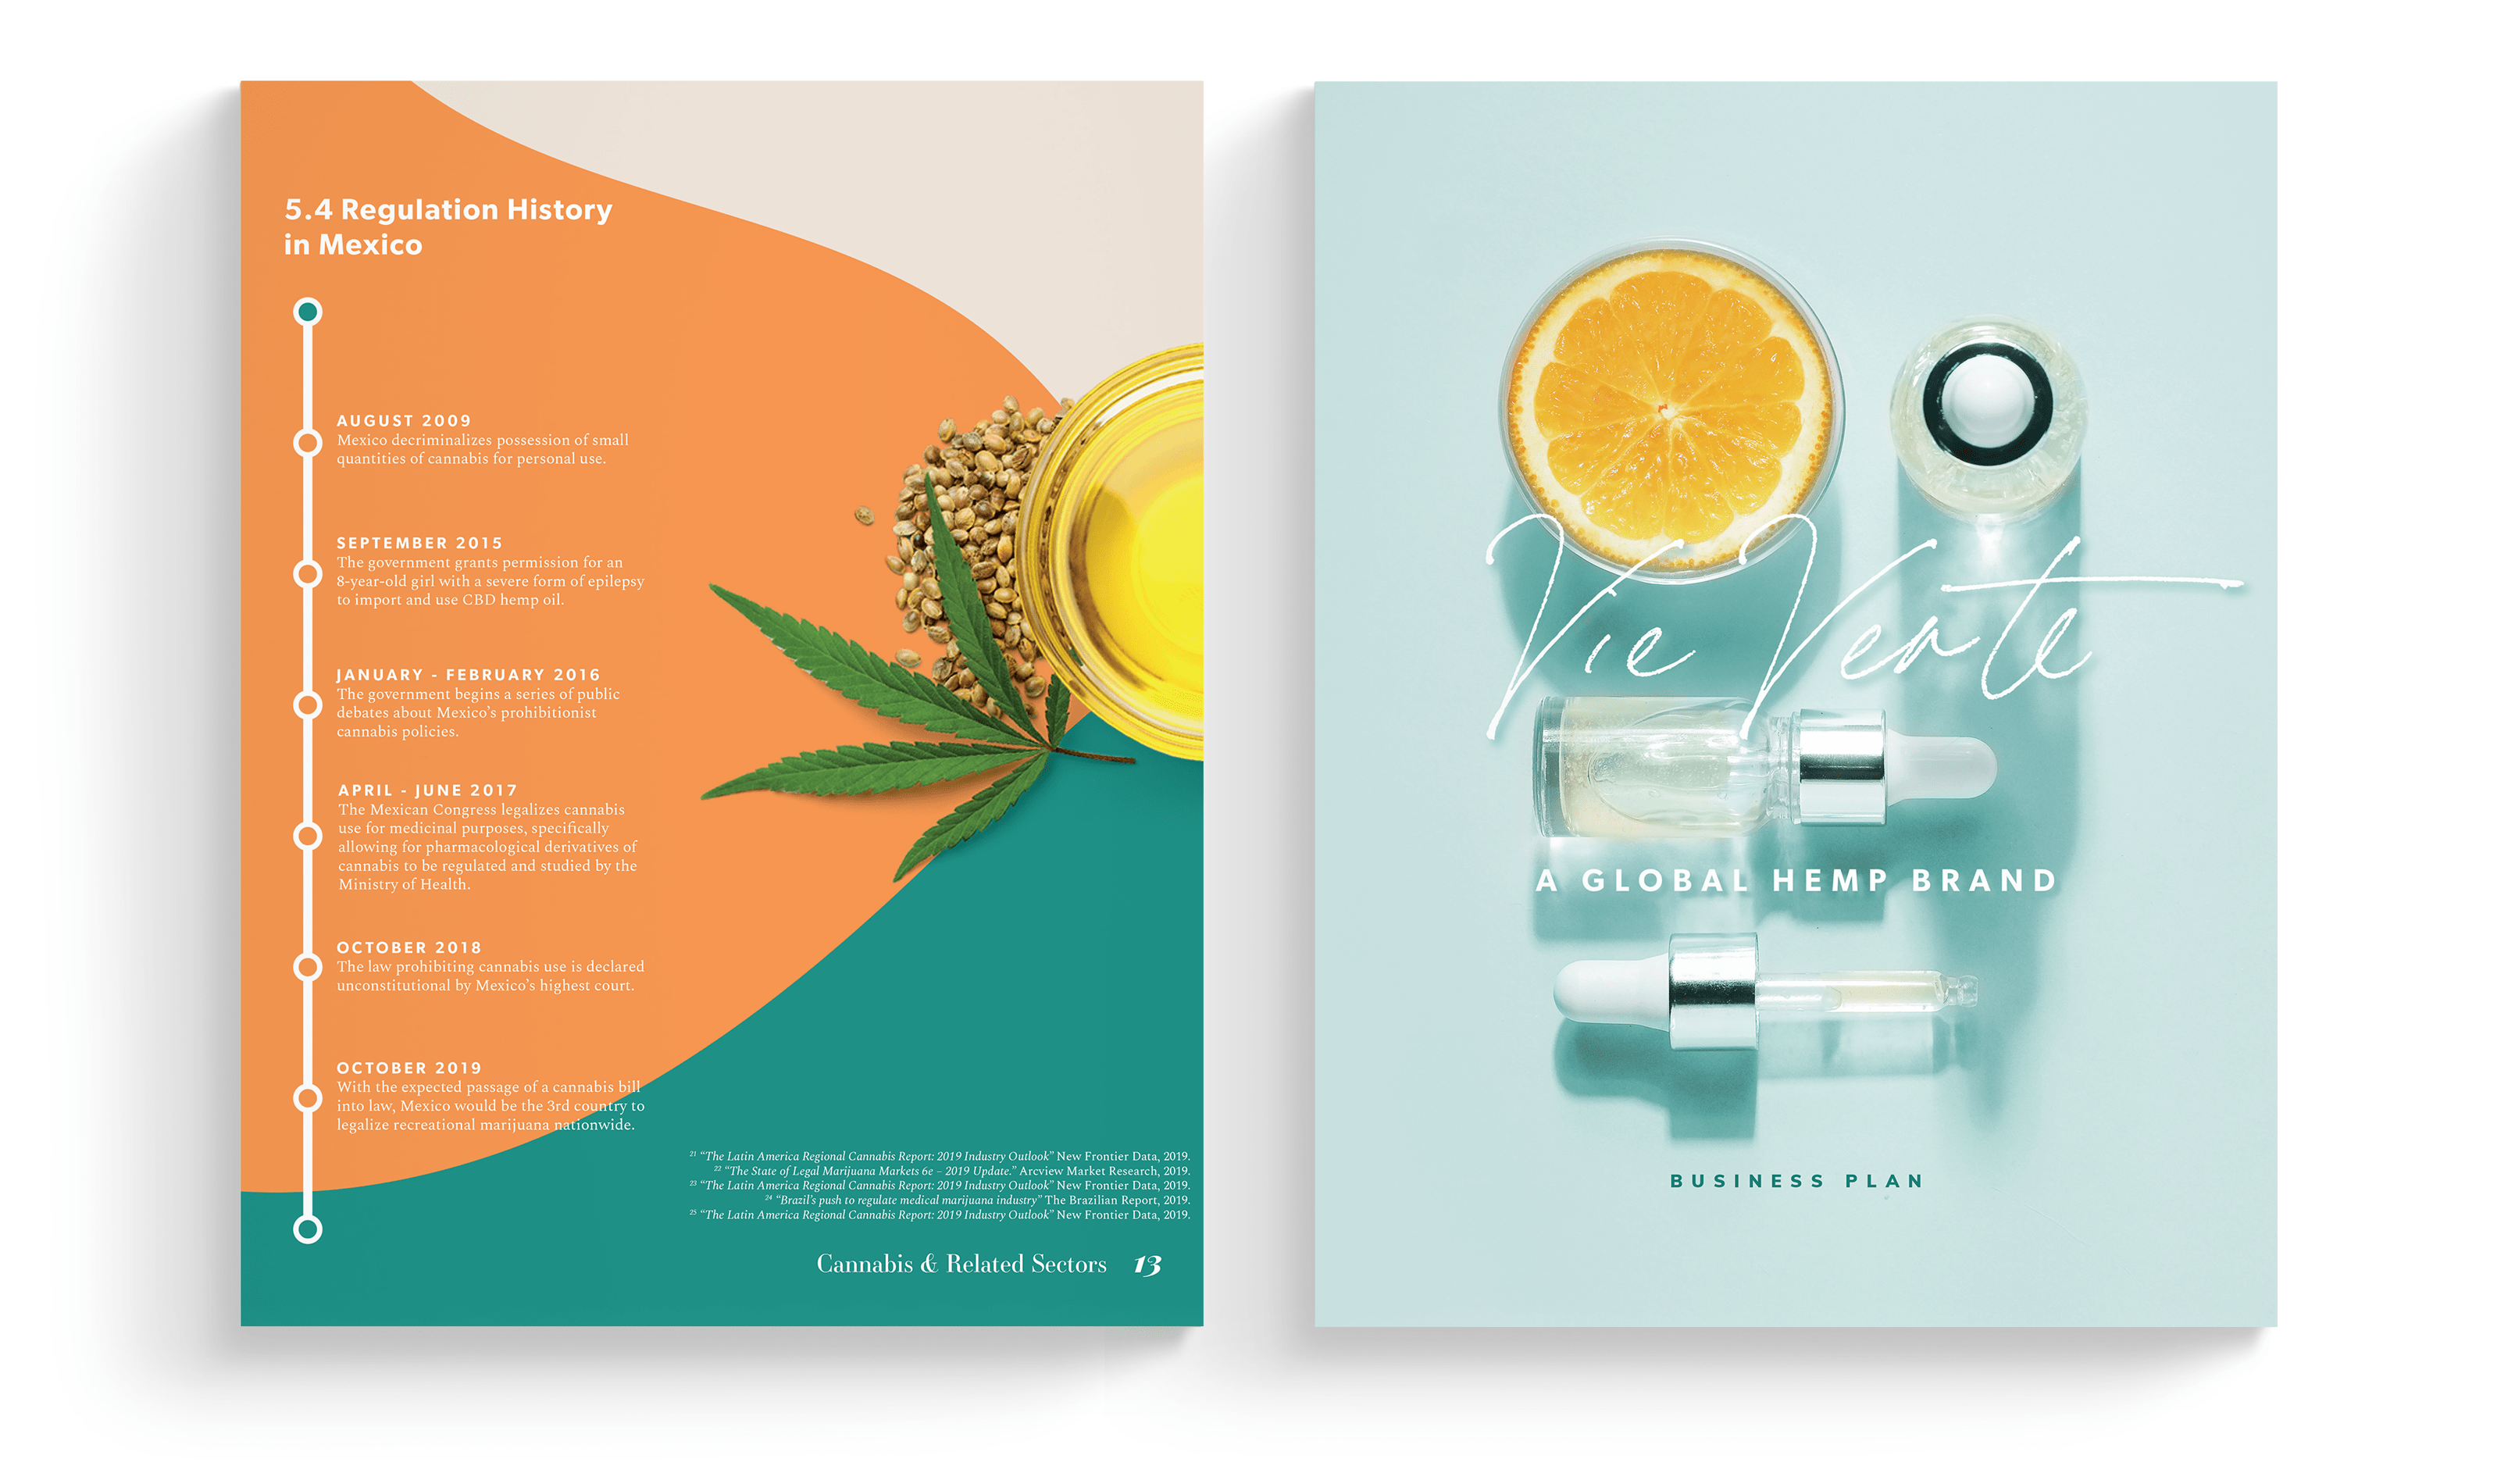
5. Timeline infographics can highlight a sequence of events or milestones
Timelines a great tool for a number of things: showcasing relevant industry events (particularly if your industry is heavily influenced by regulatory developments,) highlighting your achievements through the growth of your company, projecting milestones for the future of your company, and more.
Looking to strengthen your business plan? Van York Agency can help.
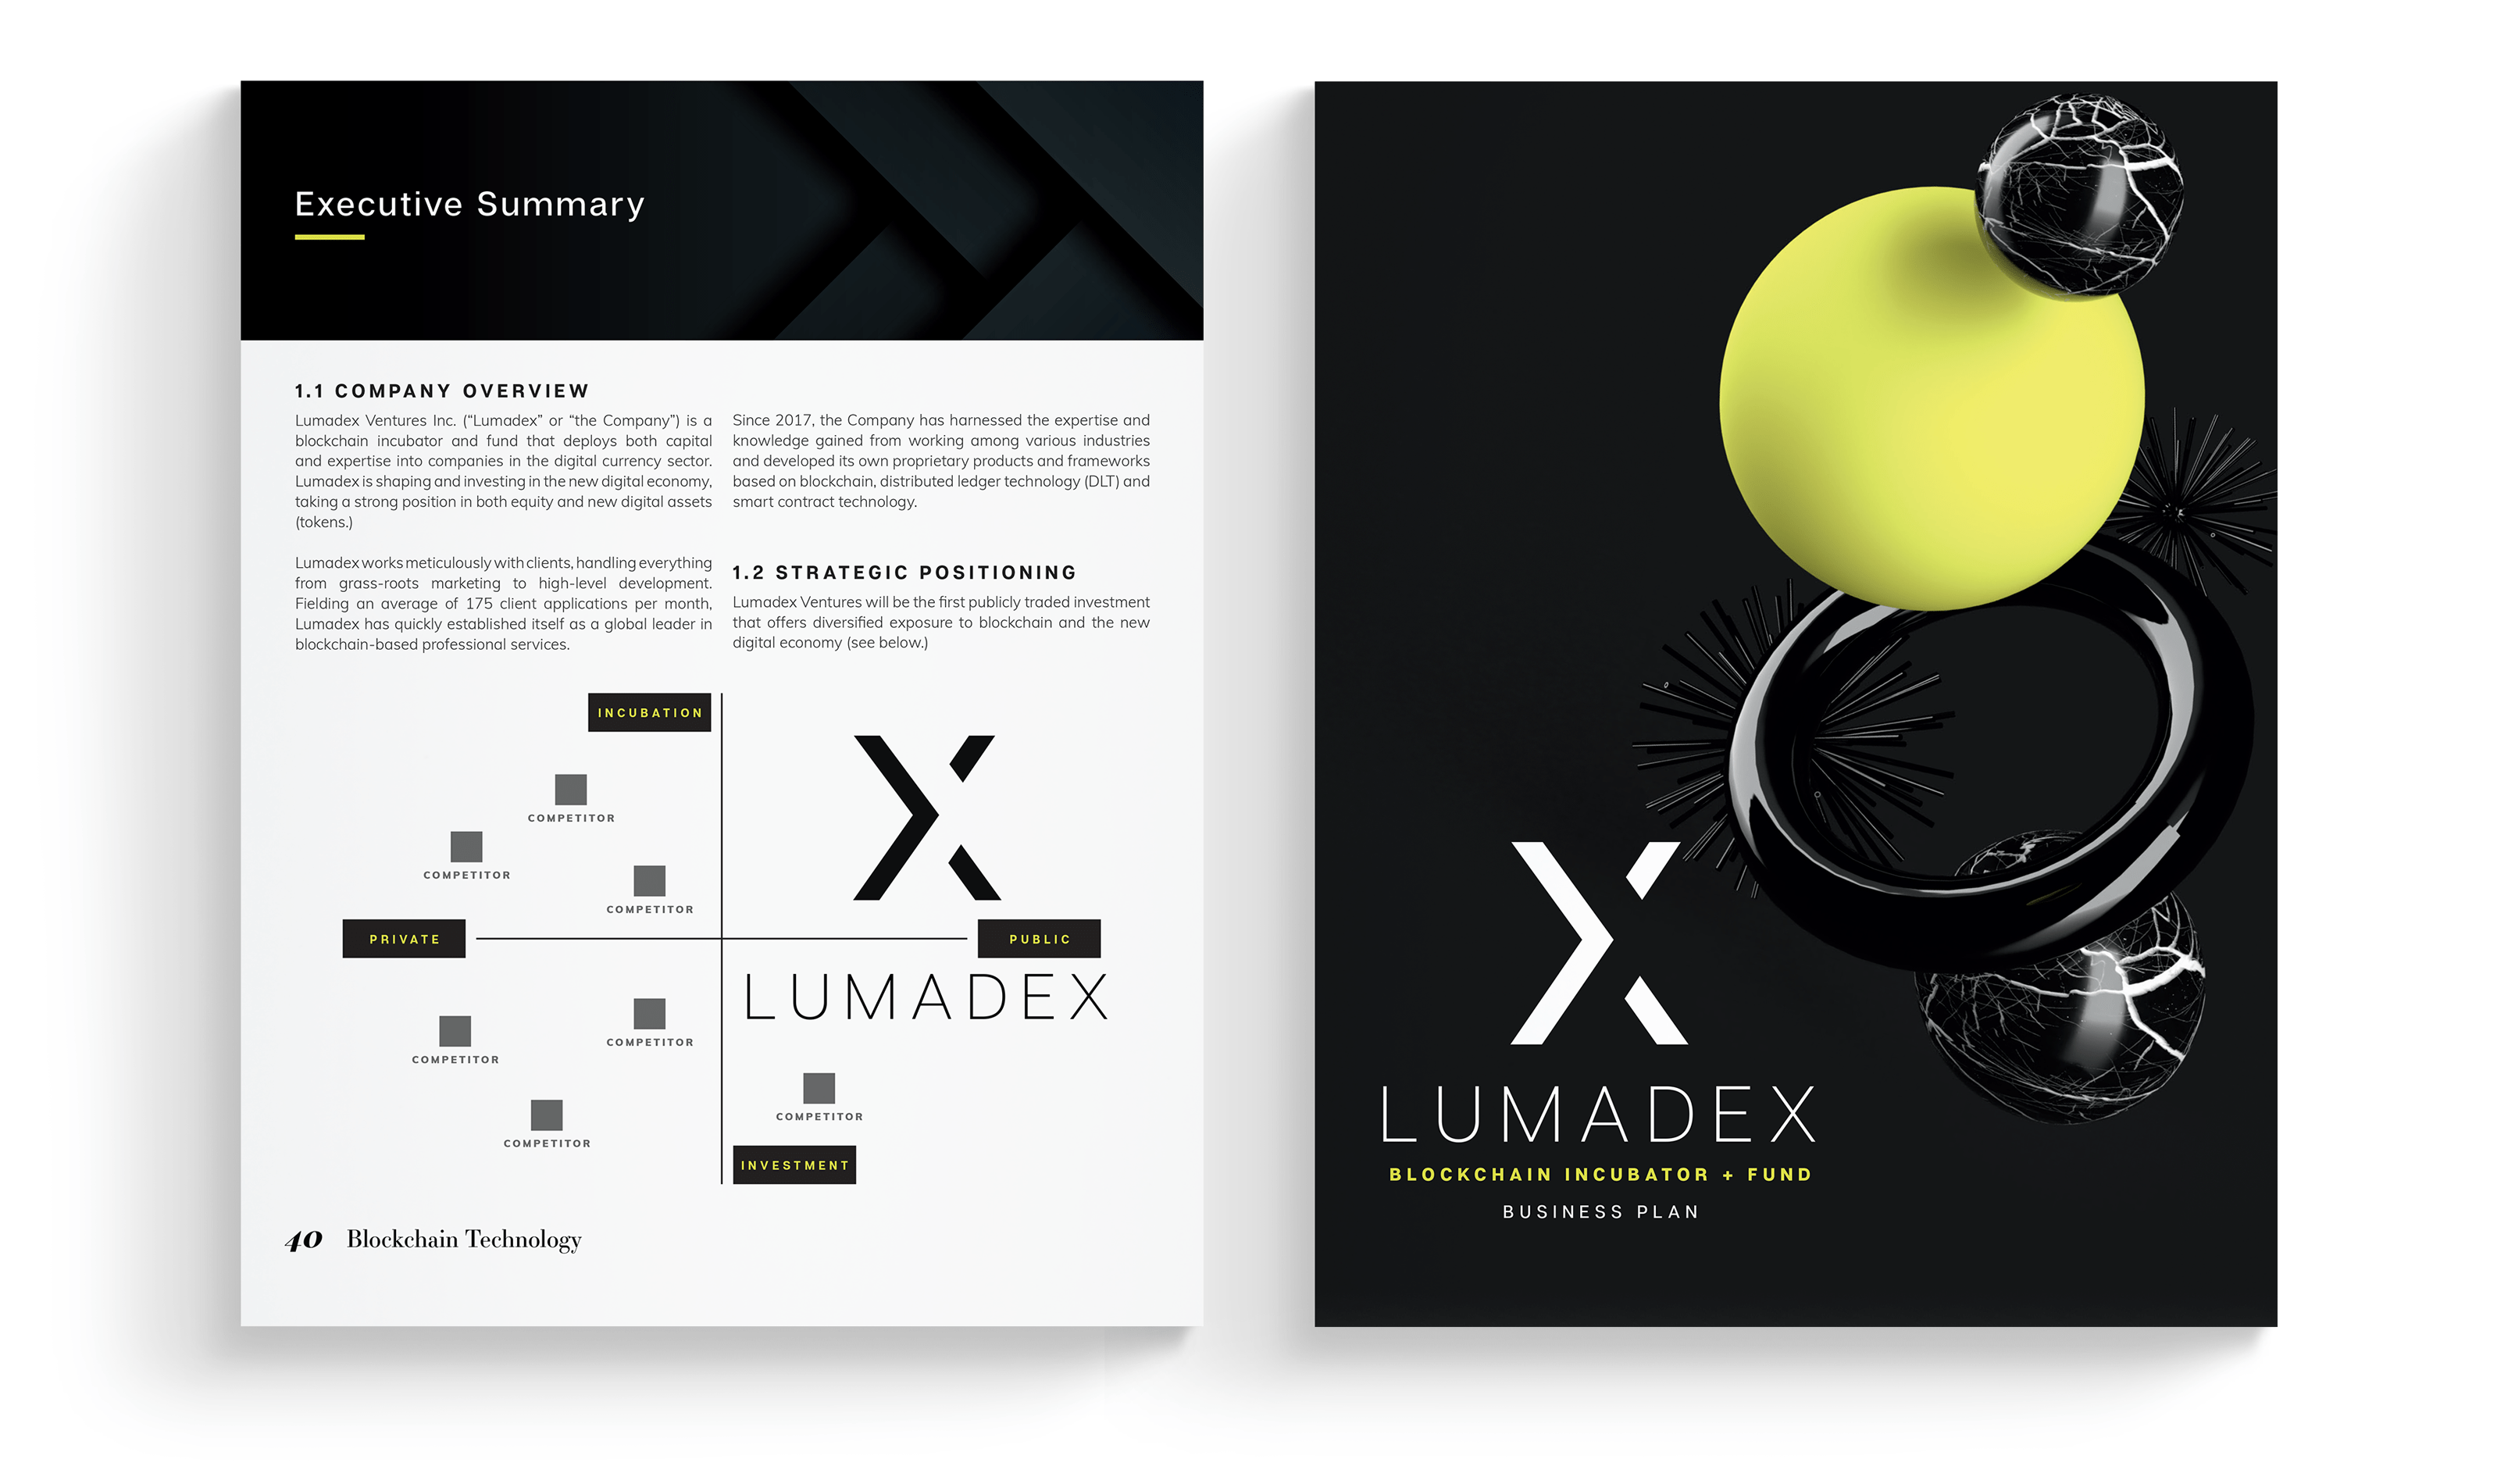
6. Quadrant charts and matrix models can help you illustrate your company’s positioning
Quadrant charts and matrix models are great tools for demonstrating where an element (whether it’s your company or your industry as a whole) is positioned within a pair of dichotomies. This is useful particularly when conveying your positioning compared to your competitors.
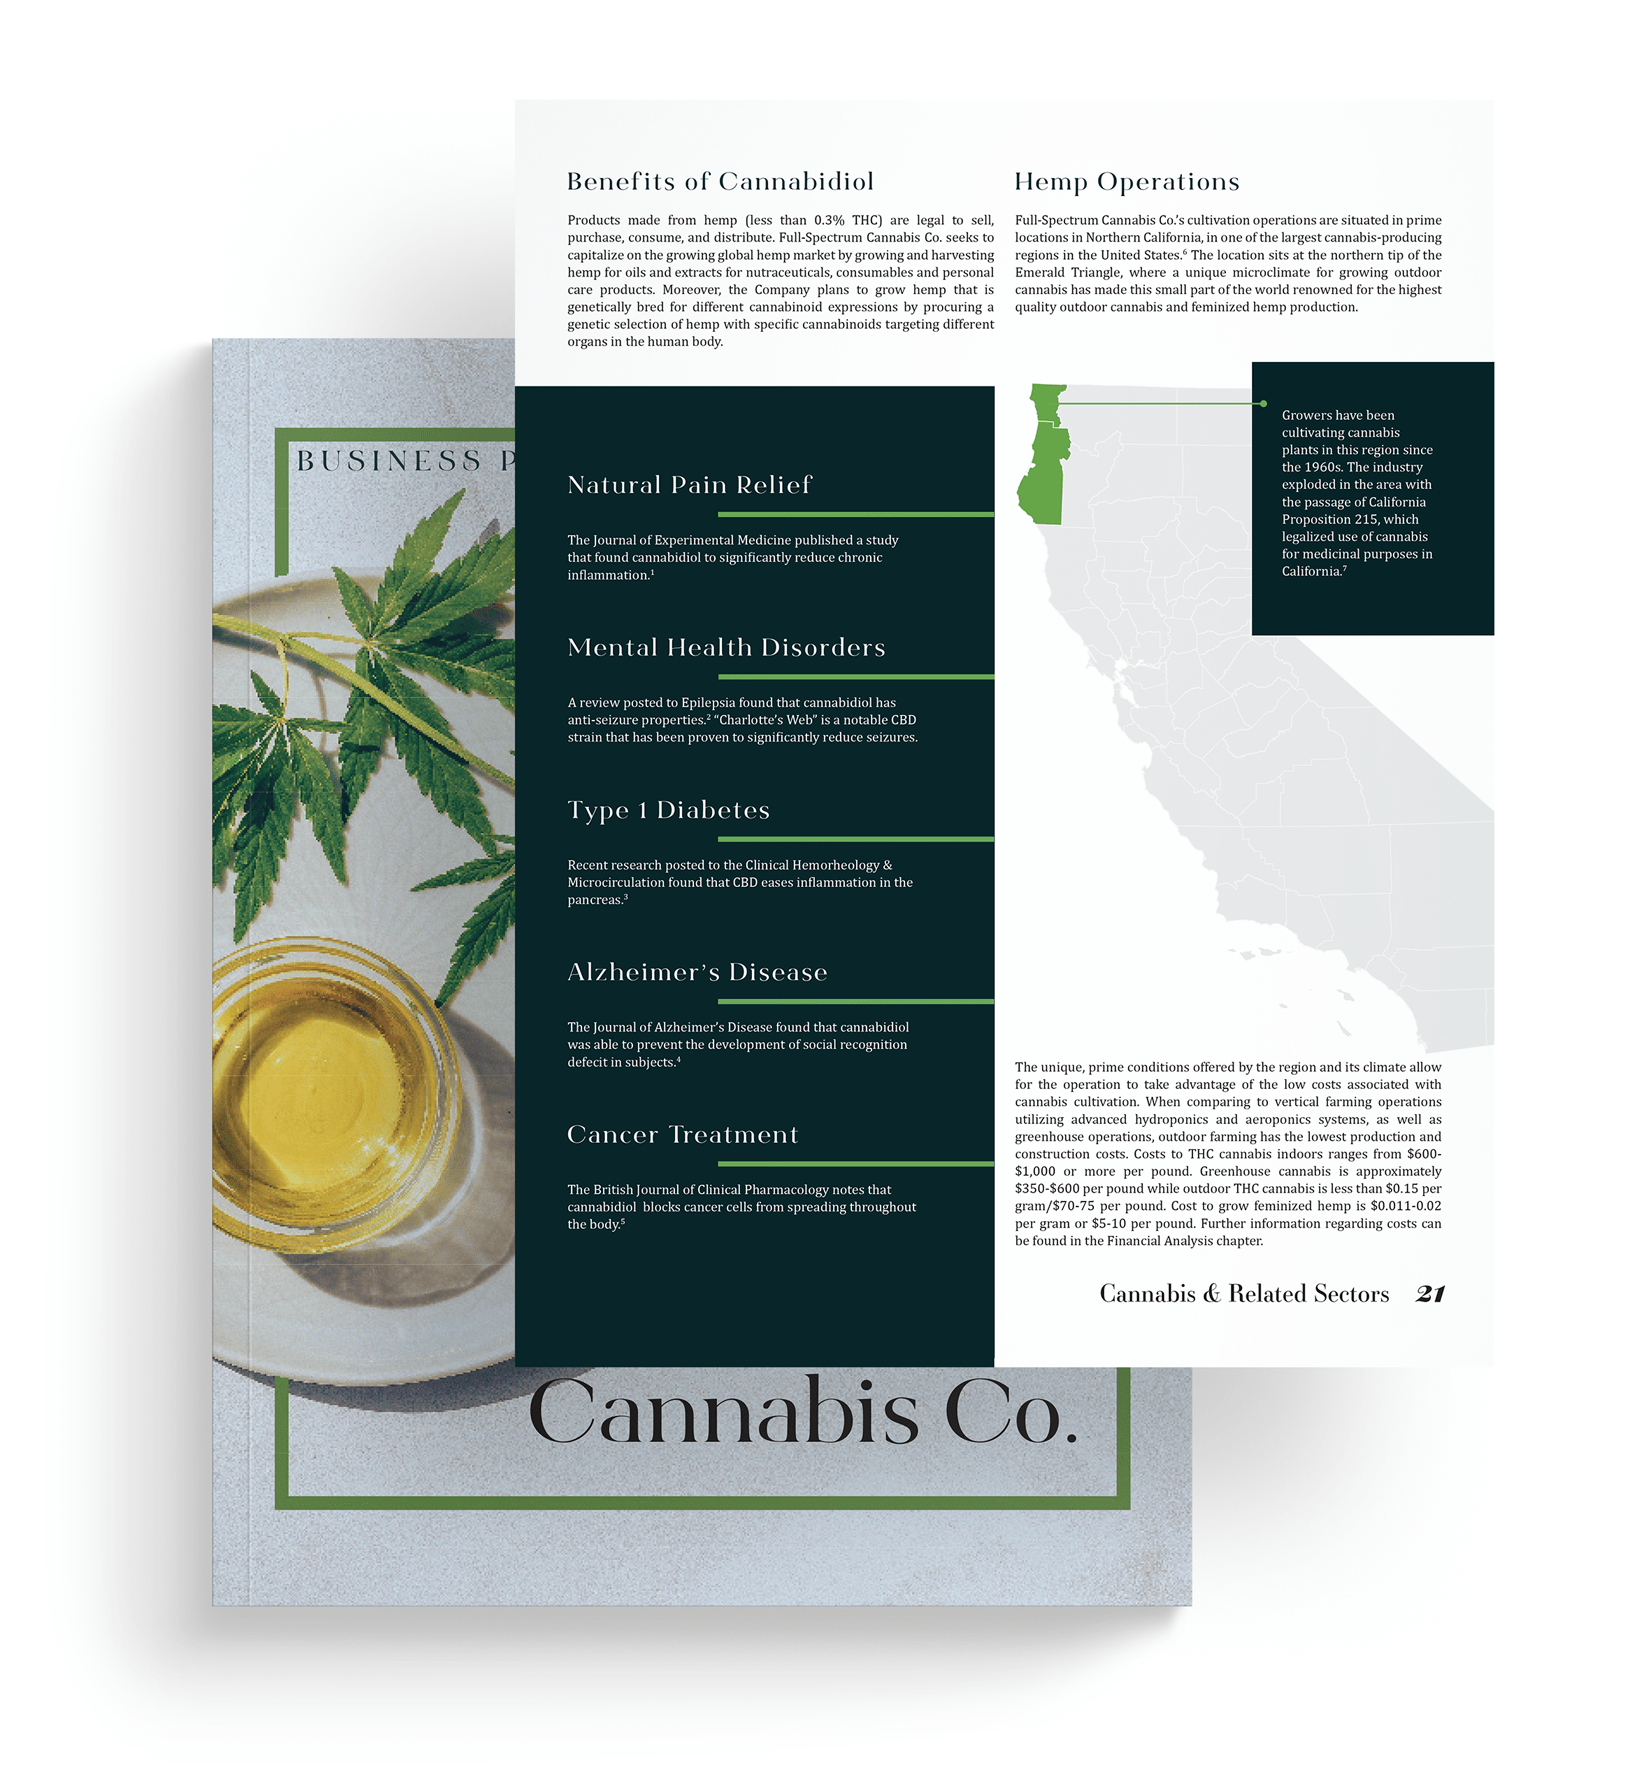
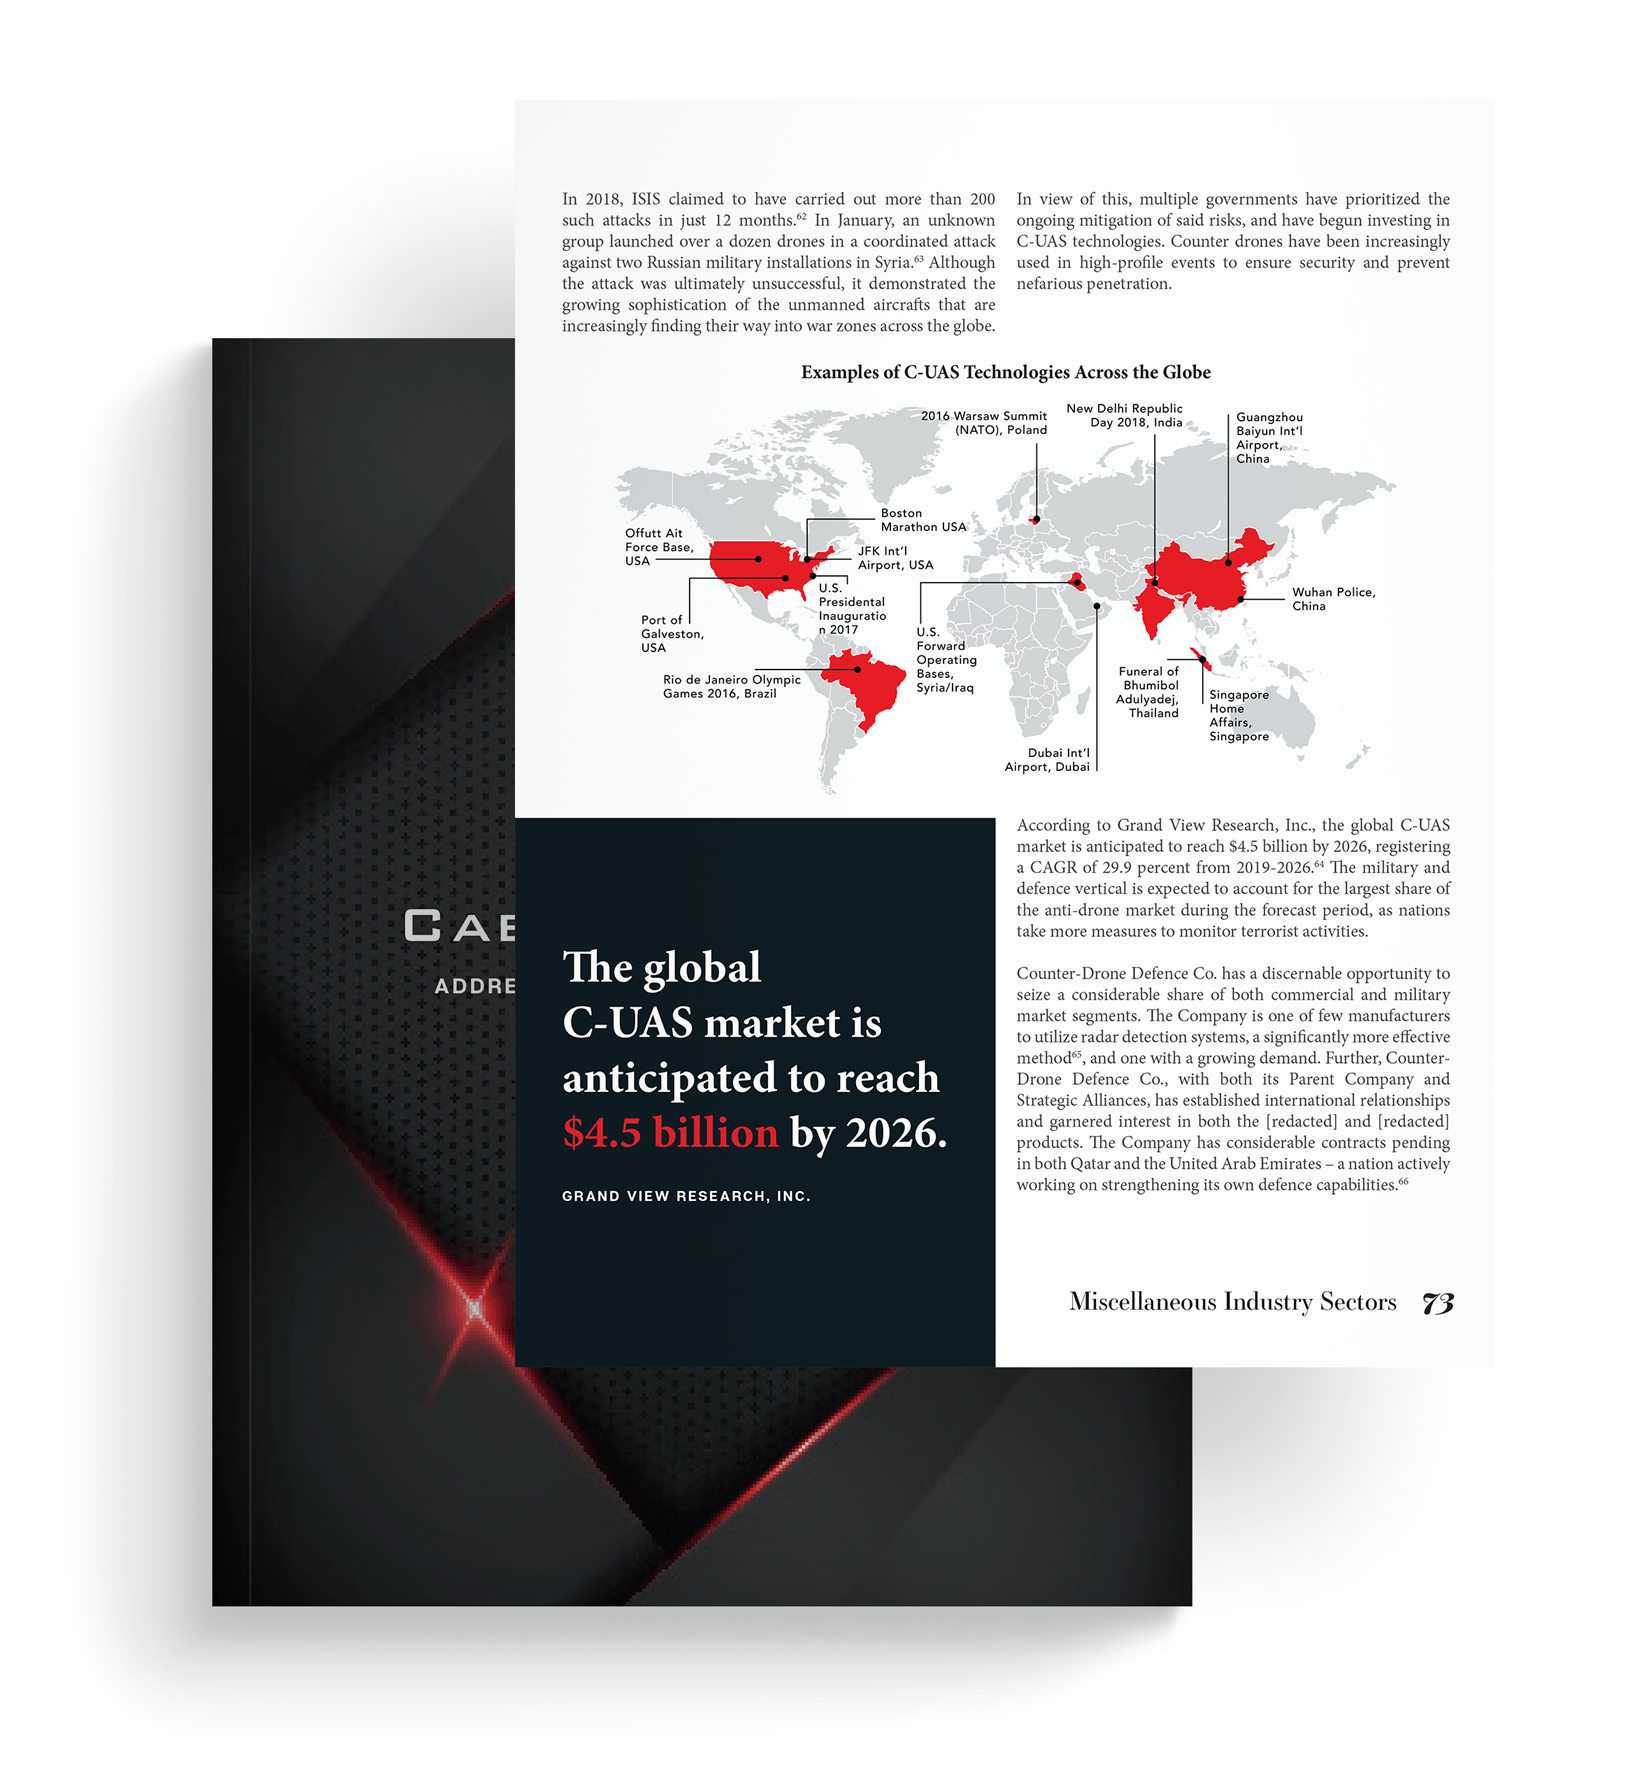
7. Geographic maps allow you to relay locational data in one, clear snapshot
There are countless instances when locational data can support your business plan. Perhaps you have multiple facilities or storefronts around the nation – or the globe. Or maybe you find it useful to showcase global market activity. In any case, presenting this information directly on a map can be beneficial in that it gives your reader a clean snapshot of your company’s reach, or the impact of a particular market trend.
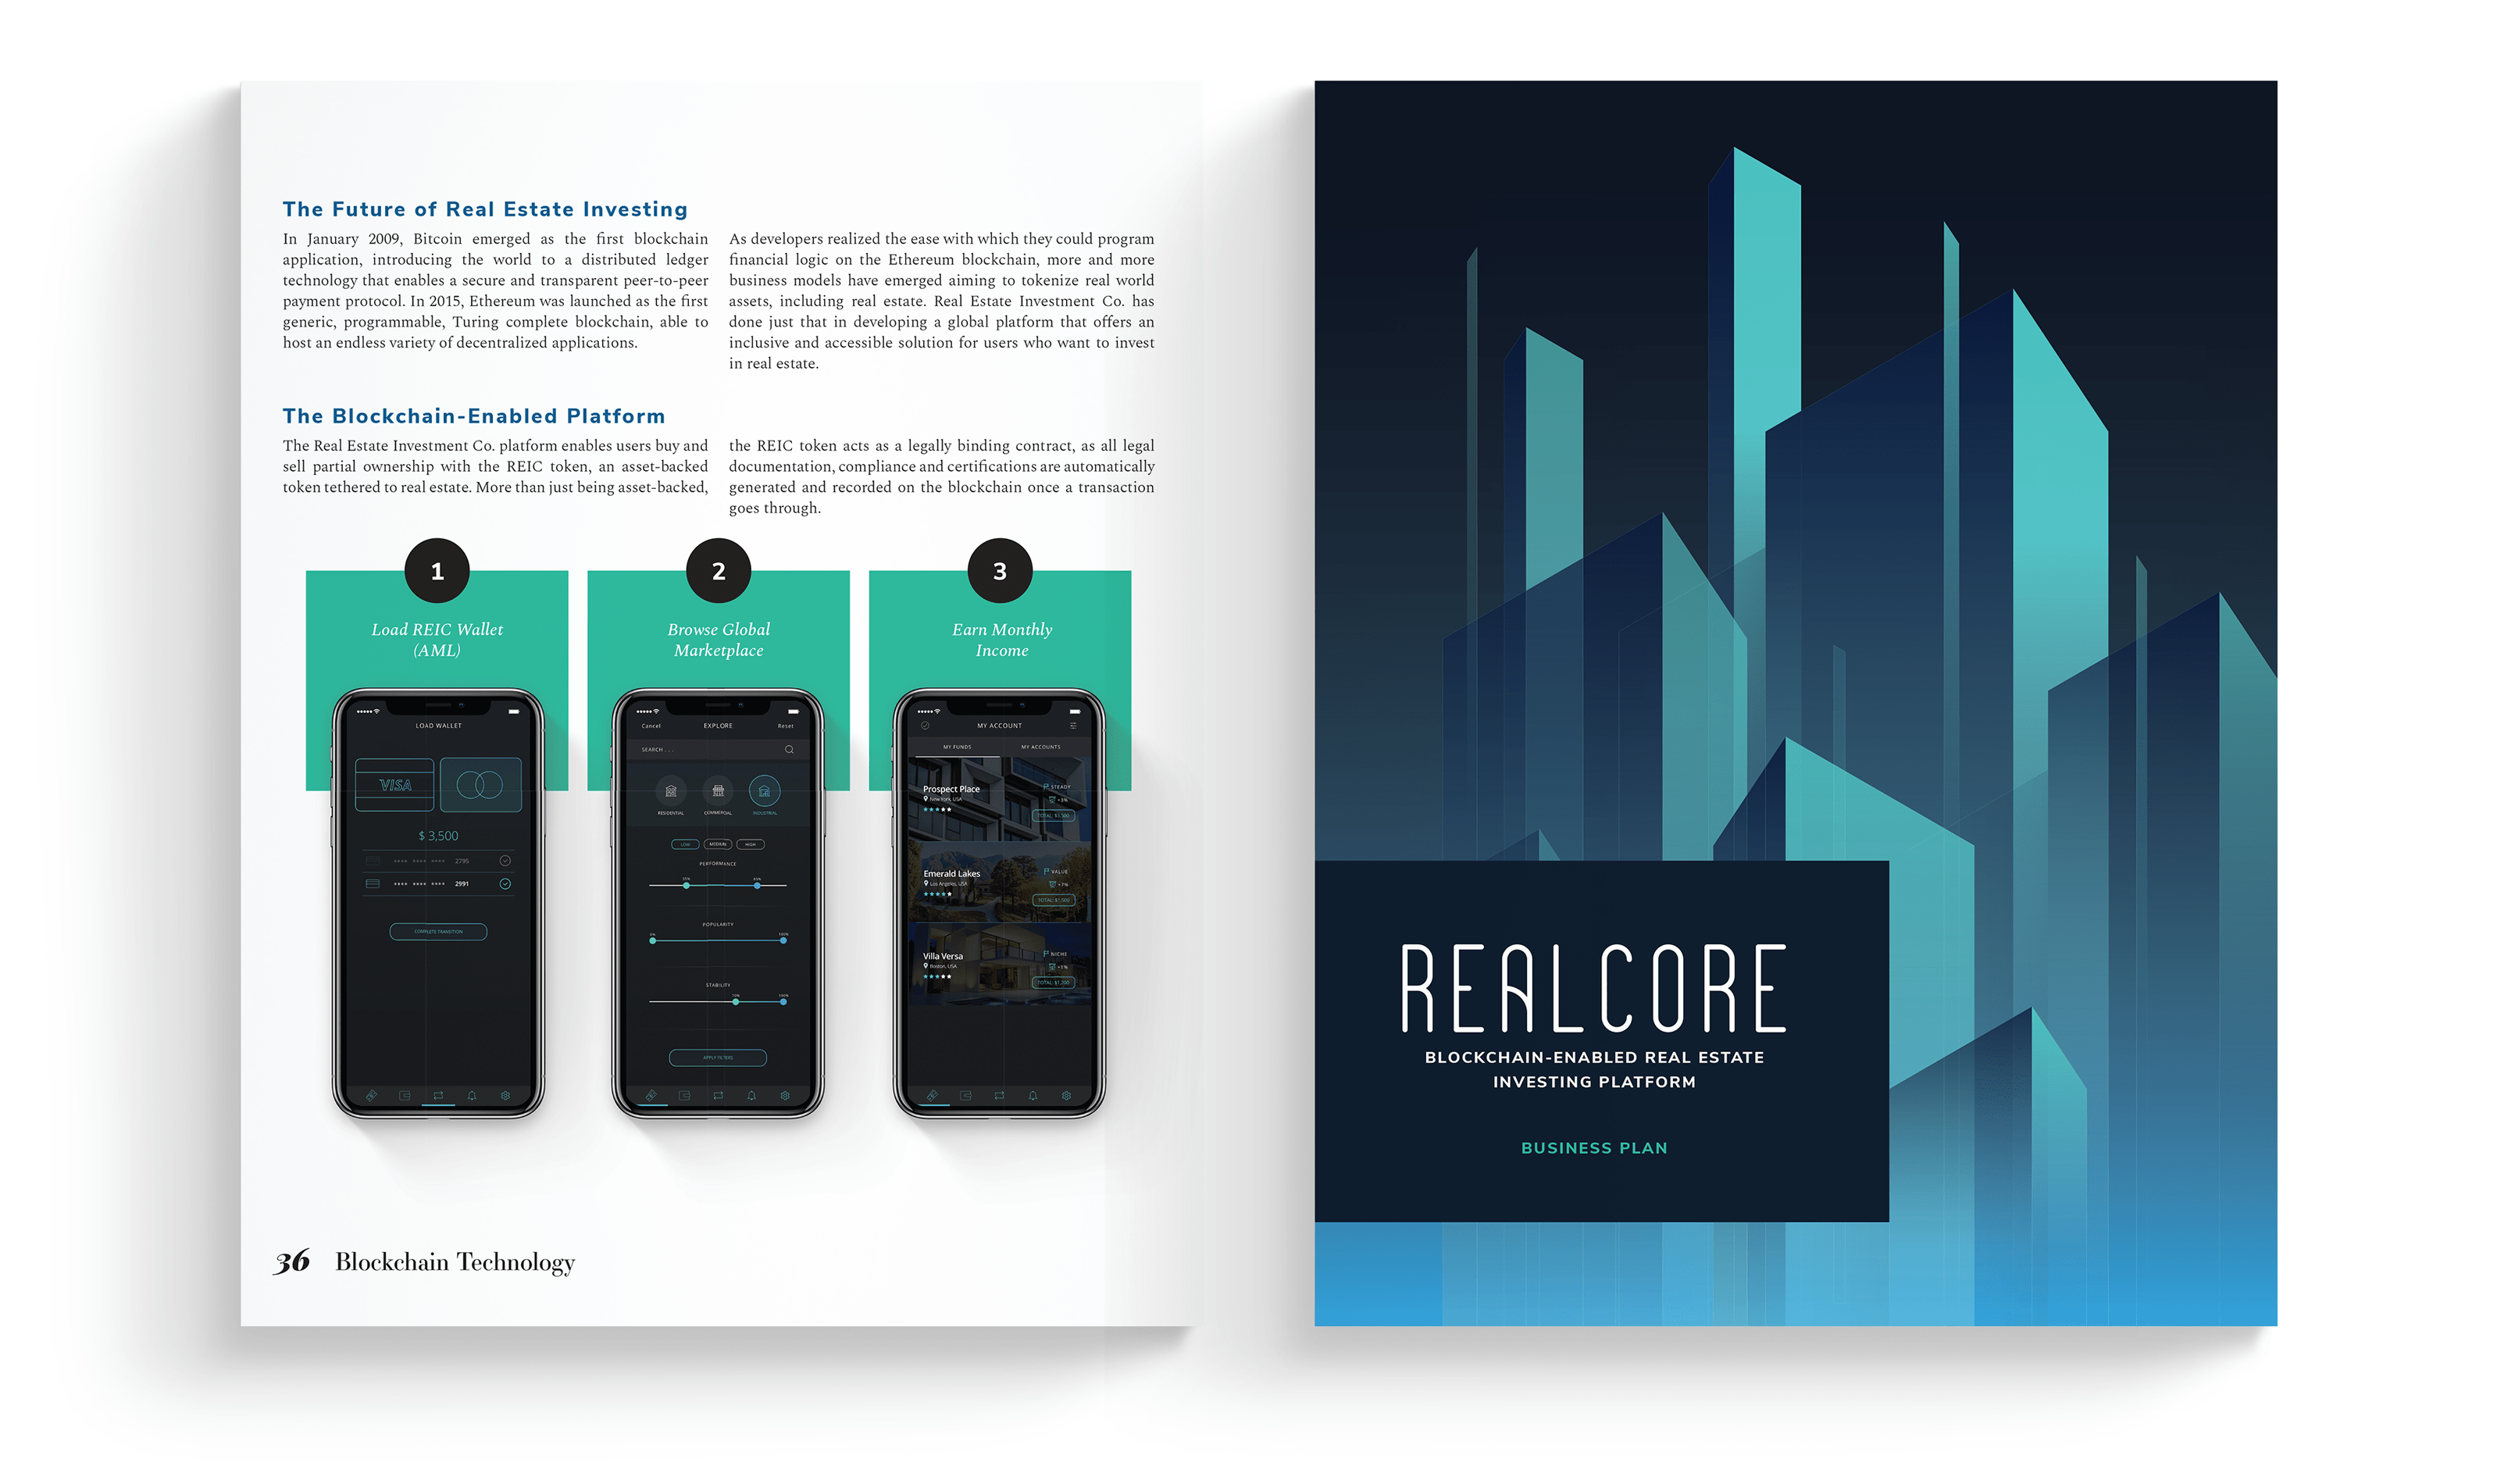
8. A process infographic can demonstrate your product’s step-by-step solution
If your principal revenue driver is that of product development and distribution (be it a physical product or software,) it may be helpful to demonstrate how your product is meant to be used. This is especially true for mobile app development. Visually guiding a reader through your app helps them understand your product in the most effective way possible – short of presenting the product alongside your business plan.
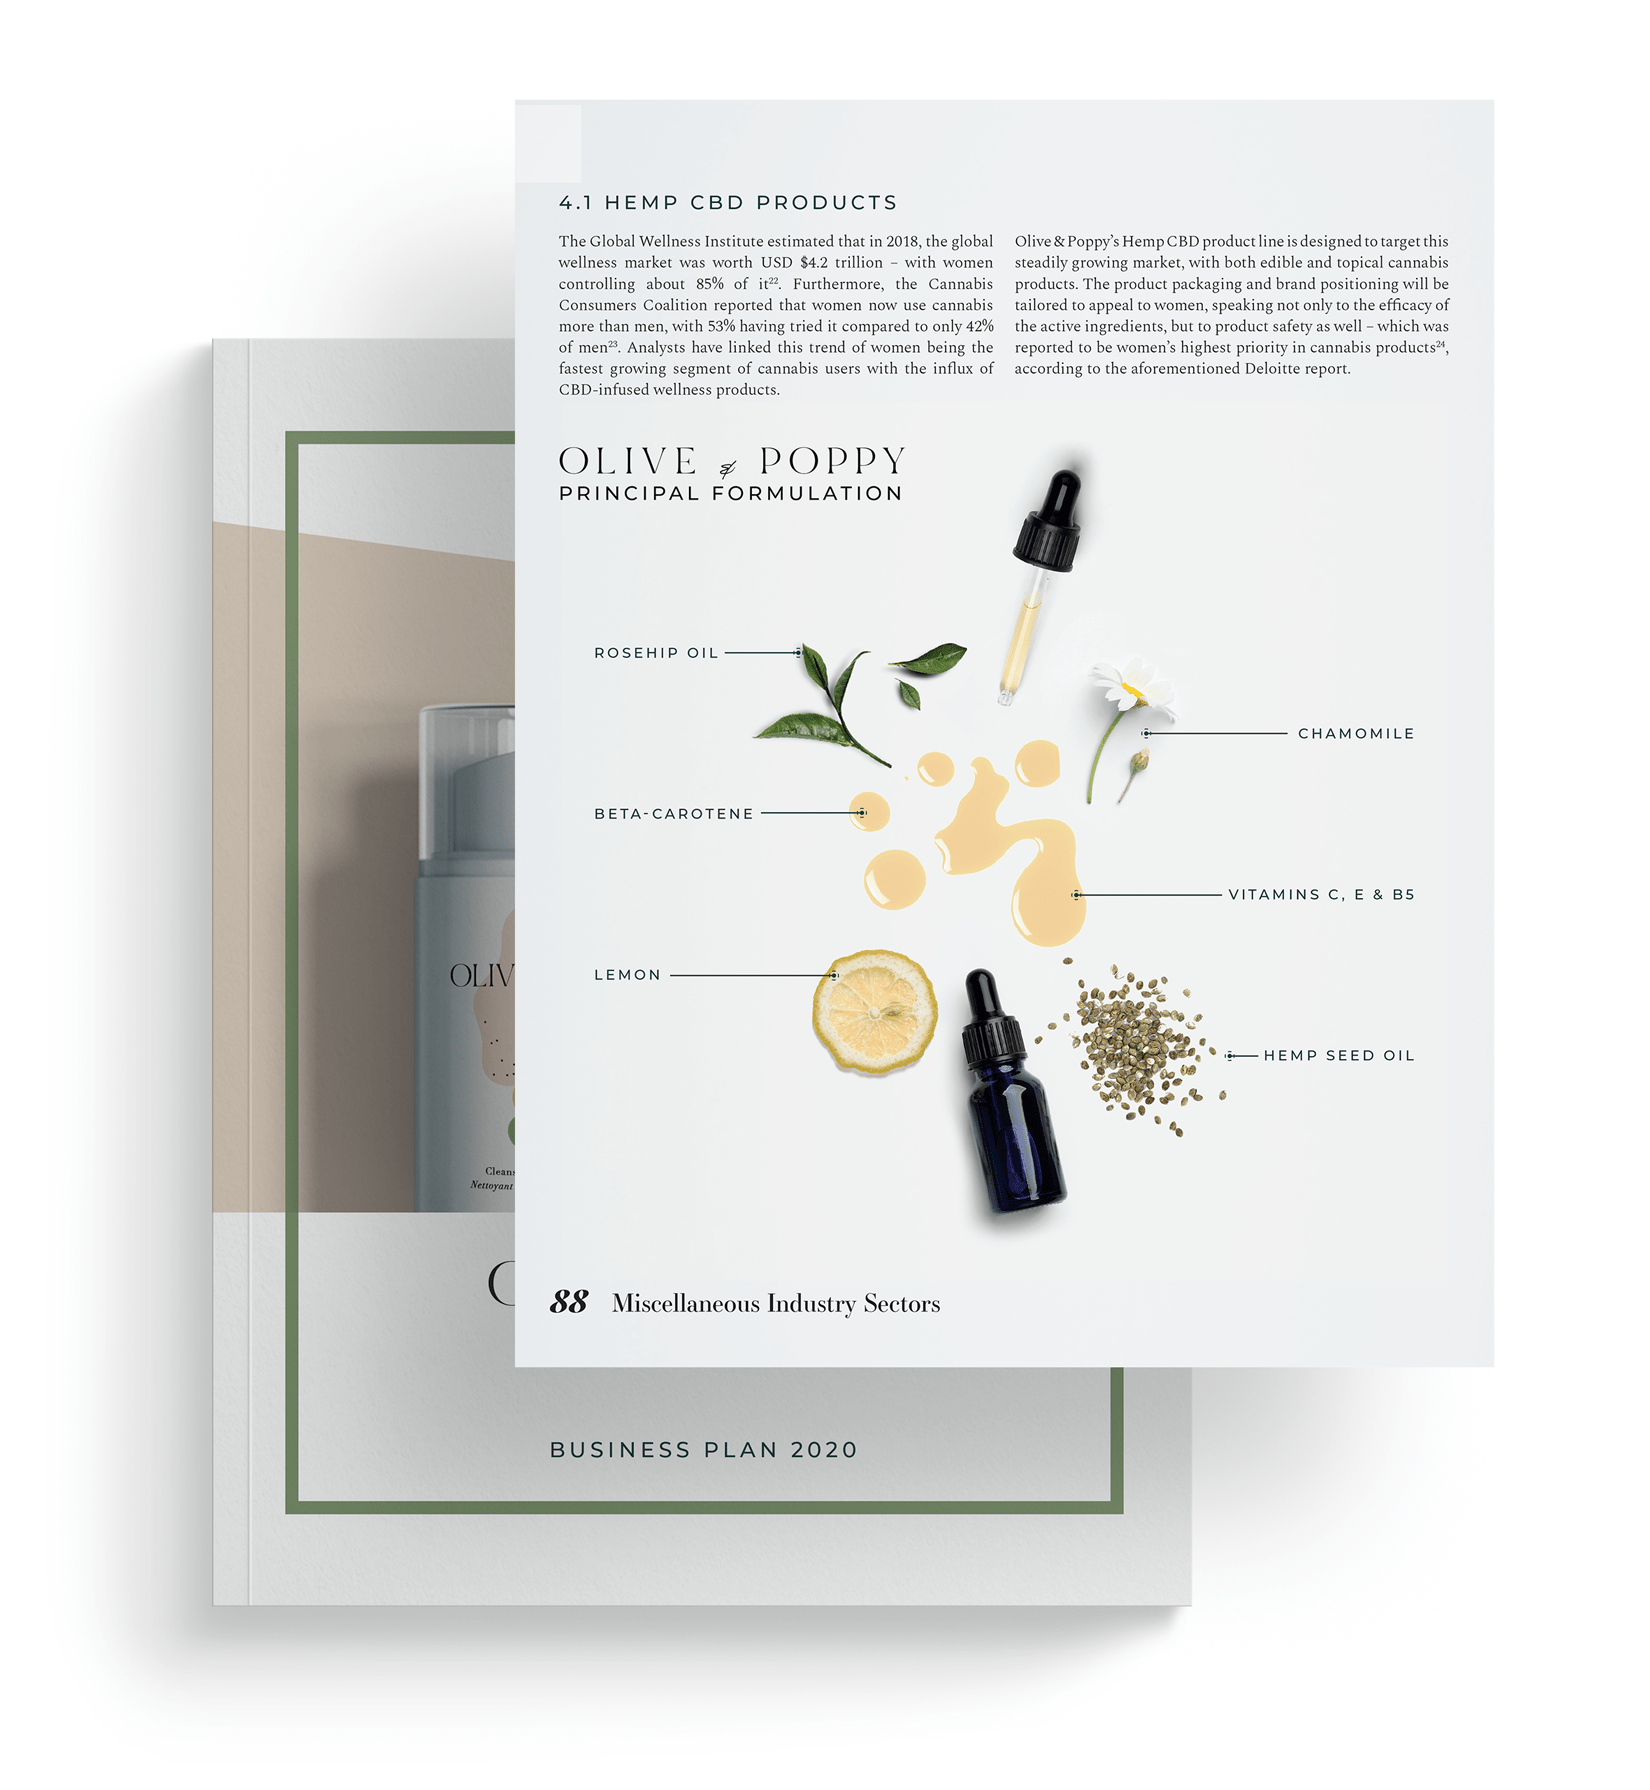
9. Anatomical infographics can deconstruct products or systems by individual components
In a similar vein, anatomical infographics are useful in instructing a reader on how something works, or what’s in a particular product (i.e. key ingredients.) Both process and anatomical infographics help add an educational component to your business plan, which is incredibly useful when explaining the value of your product.

10. List infographics can summarize key points under one, defined heading
Finally, sometimes the best way to summarize an idea or message is with a concise list. Traditionally, business plan writers use bullet-point lists to make their point. If you’re shining a spotlight on an area you deem to be important, consider spicing up that bullet point list with relevant icons. Remember, visual aids are more persuasive than text alone. Using them strategically throughout your business plan can emphasize key points that might have otherwise been lost or overlooked by the reader.

In Summary:
Business plans are important documents that serve to convey key information and data – from market activity and growth to projected revenues and return on investment. In these instances, brevity and transparency are crucial – more so than any flash or polish. Infographics, when used strategically, enforce the former while maintaining the latter. They improve the comprehension of your document while ensuring it is memorable and compelling. They help tell a story in a language the reader inherently understands – because that reader lives in a world where infographics are more prevalent than they ever were before. In all likelihood, your business model is innovative, forward-thinking and unique to you. We argue that your business plan should be too.
Note: All graphics featured in this post were created by Van York Agency Inc.
References
[1] Vogel, D. R., Dickson, G. W. & Lehman, J. A. (1986). Persuasion and the Role of Visual Presentation Support: The UM/3M Study.
[2] Wyble, B., Potter, M.C., Hagmann, C, & McCourt, E.S. (2013). Detecting meaning in RSVP at 13 ms per picture, Attention, Perception, & Psychophysics. 76, 2. 270–279.

Katya Polo is a business development professional with both an MBA and over a decade of digital design experience. Specializing in both strategic planning and brand development, Katya has produced 75+ business plans and pitch decks that have helped raise over $1.3 billion in investment capital.
How can we help you?
Get in touch with us to speak with a consultant and start working with a multi-functional marketing agency.